data · · 14 Min Read
How to Improve Text-to-SQL Accuracy on Real Databases
AI-written SQL rarely errors. It returns believable wrong numbers. Five failure modes with worked SQL, and a four-layer fix to improve text-to-SQL accuracy.

How to improve text-to-SQL accuracy on real databases
To improve text-to-SQL accuracy, give the model the business context it cannot guess: write down your metric definitions, save verified queries for common questions, test it against questions with known answers, and show the SQL and assumptions behind every answer. Most wrong answers are valid SQL built on a wrong reading of your data.
The new AI dashboard says Q3 revenue was $700K. Finance says $300K.
Nobody can find the bug. The query is clean: sensible aliases, a tidy join, no errors. It runs in under a second. An analyst reads it three times before spotting the problem. The AI was asked for revenue and items sold, so it joined orders to their line items, and every order was counted once for each item in it.
That's what text-to-SQL failure looks like in practice. No syntax error and no crash, just a confident, plausible, wrong number that's one meeting away from a board deck.
The demo problem
Text-to-SQL demos impress because they run on tidy data. The tables are called customers and orders, every column has an obvious name, and there's one way to count revenue.
Real databases have:
- three columns that could all be "the date"
- a
userstable and ausers_v2table, and only one of them is live - test accounts, internal accounts and refunds mixed in with real activity
- definitions that live in a senior analyst's head and nowhere else
The research matches what teams see in production:
- Benchmarks flatter the models. Top scores on the classic Spider 1.0 benchmark are above 86%. On harder, more realistic benchmarks such as Spider 2.0-Lite, the best published score is about 70%, and agentic scores on BIRD-Interact are below 30%, according to the figures compiled in Omni's write-up.
- Most errors are about meaning, not syntax. A study of 4,602 incorrect queries, cited in the same Omni piece, found 81.2% were schema-level mistakes: wrong tables, wrong columns, wrong joins.
- Real business questions are harder. In Snowflake's 2024 evaluation on realistic BI questions, single-shot GPT-4o was correct 51% of the time.
- Models are improving, but context still decides. dbt Labs' 2026 benchmark shows text-to-SQL rising from 32.7% (2023) to 64.5% (2026) on the same questions. With some data modeling added, the best model reached 90% in the same dbt Labs benchmark.
Modern models write syntactically valid SQL almost every time. What they can't do is guess how your business works. Text-to-SQL accuracy is mostly a context problem, not a model problem. A smarter model writes more fluent SQL against the same misunderstanding. That's also why AI BI is more than text-to-SQL: the generation step is the easy part.
That's good news, because context is something you control. First, though, it helps to know exactly how a valid query ends up wrong.
If the SQL is valid, how can the answer be wrong?
Almost every wrong AI answer fits one of five failure modes. Each one below has an example, the SQL, and a quick way to spot it.
1. Ambiguous metrics
Ask "how many active customers do we have?" and the AI has to choose what "active" means. Here are two reasonable readings:
-- Reading A: anyone who logged in during the last 30 days
SELECT COUNT(DISTINCT user_id) AS active_customers
FROM sessions
WHERE started_at >= now() - interval '30 days';

-- Reading B: anyone with a paid subscription right now
SELECT COUNT(*) AS active_customers
FROM subscriptions
WHERE status = 'active';
Both run. Both return a believable number. They can differ by thousands. The AI picks one, usually without telling you which, and the answer reads as authoritative.
How to spot it: ask the same question twice in different words ("active customers" vs "active users"). If the numbers differ, the definition isn't pinned down.
2. The wrong column or table
Your orders table has created_at, order_date and paid_at. One is when the cart was created, one is when the sales team logged the deal, and one is when payment cleared. Finance counts revenue on only one of them.
-- Looks right, but counts carts created in Q3, including unpaid ones
SELECT SUM(order_total)
FROM orders
WHERE created_at >= '2026-07-01' AND created_at < '2026-10-01';

-- What finance means: payments that cleared in Q3
SELECT SUM(order_total)
FROM orders
WHERE status = 'paid'
  AND paid_at >= '2026-07-01' AND paid_at < '2026-10-01';
The same goes for tables. If you have customers and customers_legacy, the AI picks whichever looks more complete, and the legacy table often does.
How to spot it: read which date column and which table the SQL uses. If you can't see the SQL, you can't check.
3. Join fan-out (the "fan trap")
This is the bug behind our $700K revenue, and the most common silent error in analytics. Data modelers call it a fan trap.
Take three orders:
| order_id | order_total | line items |
|---|---|---|
| A | $100 | 2 |
| B | $150 | 3 |
| C | $50 | 1 |
Real revenue is $300 and real items sold is 6. Now ask "show me revenue and items sold." A natural-looking query:
SELECT SUM(o.order_total) AS revenue,
       COUNT(i.item_id)   AS items_sold
FROM orders o
JOIN order_items i ON i.order_id = o.order_id;
items_sold comes back as 6, which is right. revenue comes back as $700. The join produces one row per line item, so order A's $100 appears twice, B's $150 three times and C's $50 once. Nothing errors, and nothing warns you.
The fix is to aggregate each measure at its own level before combining:
WITH items AS (
  SELECT order_id, COUNT(*) AS items_sold
  FROM order_items
  GROUP BY order_id
)
SELECT SUM(o.order_total) AS revenue,
       SUM(items.items_sold) AS items_sold
FROM orders o
JOIN items ON items.order_id = o.order_id;
Now there's one row per order, so revenue is $300 and items sold is 6.
A tempting shortcut is SUM(DISTINCT o.order_total). Don't. It quietly drops any two orders that happen to have the same total.
How to spot it: be suspicious whenever a query sums a column from one table after joining to a table that has many rows per record (orders to items, customers to orders, accounts to events). Compare the total with the same sum run on the first table alone.
4. Missing filters
Real data contains rows that shouldn't count:
- test orders from QA
- your own team's accounts
- refunded or cancelled transactions
- soft-deleted records that still exist with a
deleted_atvalue
Every analyst at your company knows to exclude them. None of that knowledge is in the schema, so the AI includes them:
-- What the AI writes
SELECT SUM(order_total) FROM orders WHERE status = 'paid';

-- What your analyst writes
SELECT SUM(o.order_total)
FROM orders o
JOIN customers c ON c.id = o.customer_id
WHERE o.status = 'paid'
  AND o.is_test = false
  AND o.refunded_at IS NULL
  AND o.deleted_at IS NULL
  AND c.email NOT LIKE '%@yourcompany.com';
How to spot it: compare the AI's answer with a number you already trust, such as last month's finance report. A consistent gap of a few percent usually means a missing filter.
5. Time traps
Timestamps are usually stored in UTC, but your business runs in a local timezone. An order paid at 8:00 pm UTC on October 31 is 1:30 am on November 1 in India. Whether it counts as October or November depends on whether the query converts:
-- Groups by UTC month (often wrong for local reporting)
SELECT date_trunc('month', paid_at) AS month, SUM(order_total)
FROM orders GROUP BY 1;

-- Groups by local month (assuming paid_at is a timestamptz)
SELECT date_trunc('month', paid_at AT TIME ZONE 'Asia/Kolkata') AS month,
       SUM(order_total)
FROM orders GROUP BY 1;
Other time traps:
- fiscal quarters that don't match calendar quarters
- "this month" including today's half-finished data
- rolling windows calculated after a date filter, so the first days of the window are missing data
How to spot it: check answers near period boundaries, and look for timezone conversion in the SQL. If there isn't any, ask why.
Better prompts won't save you
The tempting fix is to tweak the prompt: "be careful with joins," "use the right date column." That helps about as much as telling a new hire to "be careful."
Look at the five failure modes again. Each one is missing knowledge, not missing intelligence:
| Failure mode | What the AI didn't know |
|---|---|
| Ambiguous metrics | Your definition of "active", "customer", "revenue" |
| Wrong column or table | Which column and table finance actually uses |
| Fan trap | The grain of each table, and how they relate |
| Missing filters | Which rows your company never counts |
| Time traps | Your timezone and fiscal calendar |
So the fix is to treat the AI like a smart new analyst on day one. You'd give them a glossary, show them reports that are already correct, check their work, and ask to see their reasoning. That gives you four layers.
The four-layer fix
Layer 1: Write your definitions down
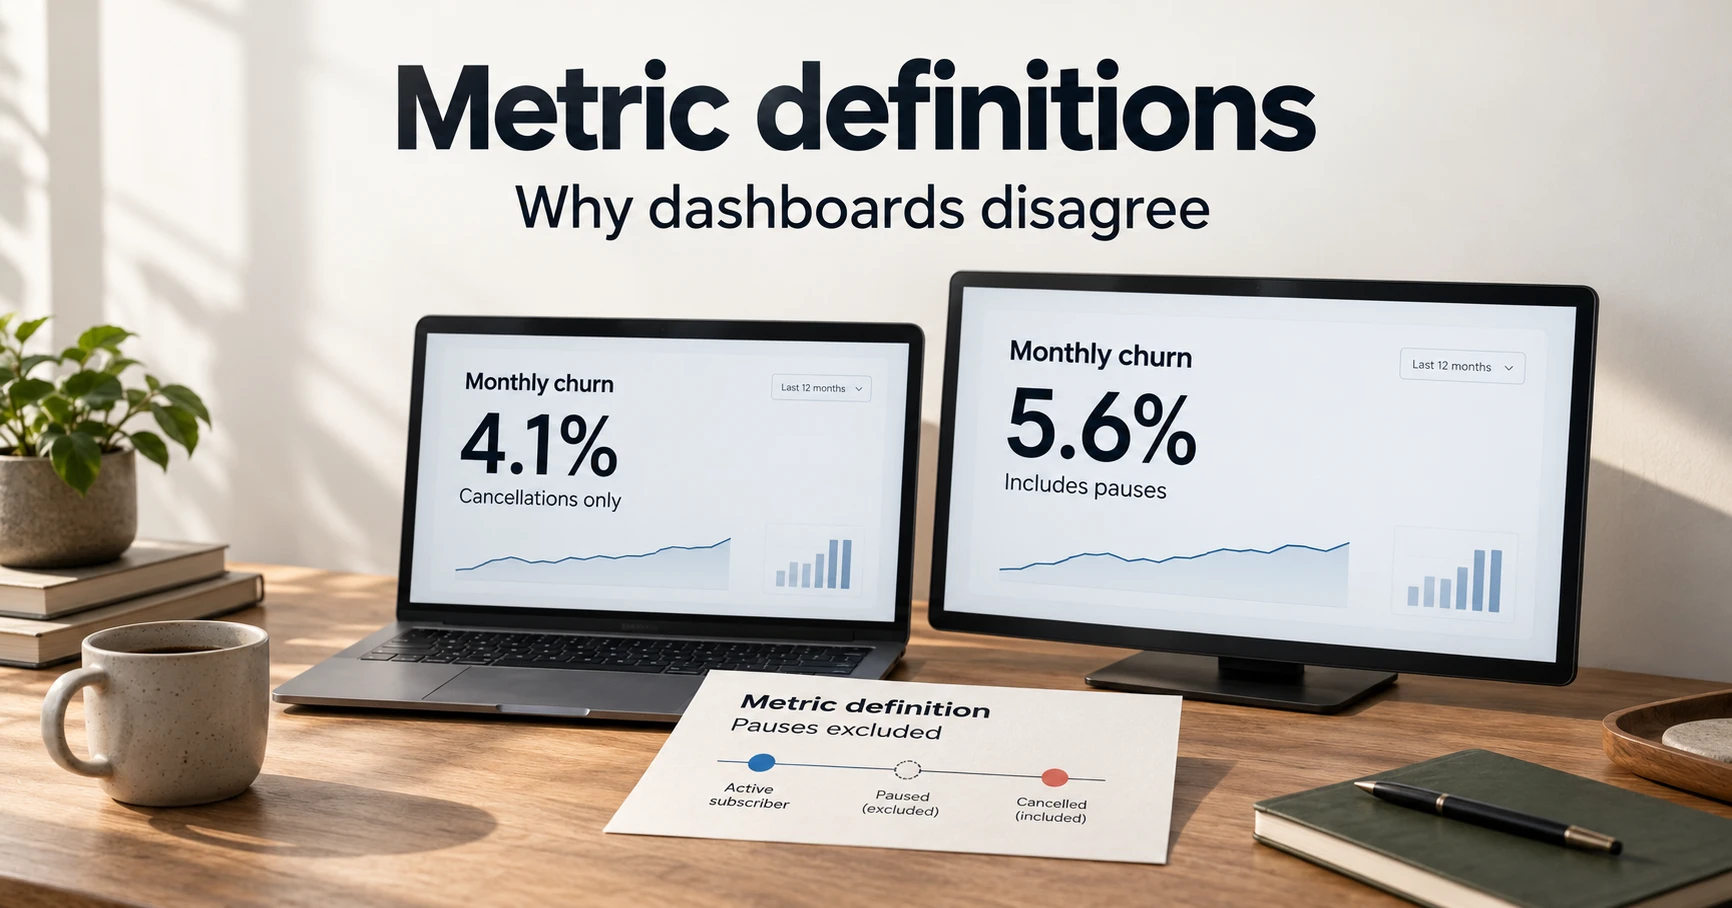
Make a plain-English glossary of the metrics and tables people get wrong. Not a 200-page data dictionary. Start with the ten questions you're asked most and write down whatever an analyst would need to know to answer them correctly. Our guide to metric definitions has a template you can copy.
A useful entry has four parts: the definition, the exact logic, the exclusions and the gotchas.
| Term | Definition | Logic | Exclusions and gotchas |
|---|---|---|---|
| Active customer | Paying and engaged | Subscription status = 'active' and a session in the last 30 days | Exclude internal emails and trials |
| Revenue | Cleared payments | SUM(order_total) where status = 'paid', dated by paid_at | Exclude refunds, test orders and soft-deleted rows; report in IST |
| orders table | One row per order | Join to order_items only after aggregating items | created_at is cart creation, not payment |
| customers_legacy | Archive | Never use | Not updated since 2023 |
You don't need hundreds of entries. A short list covering the questions people actually ask fixes most of the wrong answers.
What about a semantic layer? A semantic layer (metrics defined in code that every tool reads) is the formal version of this glossary. dbt Labs' benchmark found it's highly reliable for questions it was modeled to answer, and returns an error instead of a wrong number for questions it can't. The trade-off is setup effort and coverage: a semantic layer only answers what someone has modeled. The practical path for most teams is a plain-language glossary now, and formal metric definitions later for the numbers that go to the board.
Layer 2: Keep a library of verified queries
When an analyst has checked a query, for example "monthly revenue by region," save it. When someone asks that question again, the AI should reuse the verified SQL instead of generating new SQL that differs in some small way.
This does three things:
- Consistency. Common questions always get the same answer.
- Teaching. Verified queries become worked examples the AI learns your patterns from (your joins, your filters, your date logic).
- Speed. Reviewed answers don't need reviewing again.
Rules that keep the library healthy:
- Verify anything that leaves the team. Board decks, finance reports and customer-facing numbers.
- Give every query an owner. Finance owns revenue; growth owns activation.
- Re-verify after schema changes. A renamed column can quietly break a verified query.
- Retire what's stale. If nobody has asked a question in six months, archive its query.
Layer 3: Test it like code
Software teams don't ship without tests. AI analysts need them too. The industry calls them evals: a fixed set of questions with known-correct answers, run again whenever something changes.
How to build your first eval set
- Start with 10 to 20 real questions from Slack threads, ticket queues and recurring reports. Real questions beat invented ones.
- Get the right answer from a human. An analyst writes or approves the SQL and records the result.
- Cover all five failure modes. Include at least one question that tests a definition, a column choice, a one-to-many join, an exclusion and a period boundary.
- Grow it to 50. Every time the AI gets something wrong in real use, turn it into a new test.
How to score it
The most common mistake is comparing the AI's SQL text to the reference SQL. Two different queries can both be right. Compare results instead:
- Numbers: match within a stated tolerance (exact for revenue, ±1% for counts that change through the day).
- Lists: compare as sets, ignoring order, unless the question asks for an order ("top 5").
- Columns: check that the result has the columns the question asked for, not extra or missing ones.
- Failures: if the AI says it can't answer, count that separately from a wrong answer. "I don't know" is far cheaper than a wrong number.
A simple eval sheet looks like this (the figures are illustrative):
| Question | Expected result | Scoring rule | Tests | Owner | Last run |
|---|---|---|---|---|---|
| Revenue in Q3 2026 | $1.24M | Exact | Wrong column, filters | Finance | Pass |
| Active customers on Oct 31 | 4,812 | ±1% | Definition | Growth | Pass |
| Revenue and items sold, Q3 | $1.24M / 18,420 | Exact | Fan trap | Finance | Fail |
| October revenue in IST | $412K | Exact | Timezone | Finance | Pass |
| Top 5 regions by revenue, last 90 days | West, North, South, East, Central | Same order | Ranking | Sales | Pass |
When to run it: after any change to a table, a column, a definition, a verified query or the AI model. Track the pass rate over time. "Our AI analyst gets 46 of our 50 benchmark questions right, and here are the 4 it misses" is a sentence a CFO can trust far more than "the model is very good." Our AI data analytics benchmark is one example of scoring answers against a defined dataset.
Layer 4: Always show the work
Every answer should come with:
- the SQL that produced it
- the tables and columns it used
- the assumptions it made ("I read 'active' as logged in during the last 30 days")
- the row count behind the number, so obviously wrong scales stand out
Most business users won't read the SQL. That's fine. The point is that someone can, and that the assumptions are in plain sight for the people who don't read SQL. An answer you can't inspect is an answer you shouldn't put in front of your board.
A 30-day rollout plan
You don't need a data platform project to do this. A small team can put all four layers in place in a month:
| Week | Do this | Done when |
|---|---|---|
| 1 | List your 20 most-asked data questions. Write glossary entries for every metric and table they touch. | Every one of the 20 questions has the definitions it needs |
| 2 | Have an analyst answer the 20 questions by hand. Save the SQL as verified queries. | 20 verified queries, each with an owner |
| 3 | Turn the 20 into an eval set with scoring rules. Run the AI against it and fix the glossary wherever it fails. | A baseline pass rate you can repeat |
| 4 | Open it up to one business team. Turn every wrong answer into a new test. Re-run evals weekly. | Pass rate tracked, new tests added from real use |
A checklist before you trust any AI analyst
Use these ten questions when you evaluate a text-to-SQL tool, or audit the one you have:
- Can I see the exact SQL behind every answer?
- Can I write business definitions in plain language, and does the AI actually use them?
- Can I mark a query as verified so it's reused for the same question?
- Does it tell me what assumptions it made?
- Can I build a set of test questions with known answers and run it on demand?
- Does it handle one-to-many joins without fan-out?
- Can it exclude test, internal and refunded records by default?
- Does it handle timezones and fiscal calendars?
- Does it learn from corrections, and can I see and edit what it learned?
- Is it read-only against my database, with access limited to the right people?
If a tool can't answer yes to the first three, it's a demo, not an analyst.
Frequently asked questions
What is a good text-to-SQL accuracy rate?
It depends on the question. For exploratory questions, 80 to 90% on your own eval set can be useful, because a person checks the answer before acting on it. For numbers that go to finance or the board, aim for 100% on a verified query, and don't rely on fresh generation at all. Measure the rate on your own questions, not on a public benchmark.
Why does text-to-SQL give different answers to the same question?
Usually because a definition is ambiguous and the AI picks a different reading each time, or because it chooses a different table or join path. Small wording changes in the question can tip it either way. Pin the definition in your glossary and save a verified query for the question, so the same question always runs the same SQL.
Do I need a semantic layer for text-to-SQL?
Not to start. A plain-language glossary, verified queries and evals get most teams most of the way. A semantic layer is worth adding for the handful of metrics that must never be wrong, such as the revenue and retention numbers that go to the board, because it returns an error instead of a wrong number for questions it was not modeled to answer.
How many questions should a text-to-SQL eval set have?
Start with 10 to 20 real questions and grow to about 50 by adding every real failure as a new test. Coverage of the five failure modes matters more than the total: include at least one question on a definition, a column choice, a one-to-many join, an exclusion and a period boundary.
What is the difference between execution accuracy and exact-match accuracy?
Exact-match accuracy compares the generated SQL text to a reference query. Execution accuracy runs both and compares the results. Two different queries can both be right, so exact match undercounts correct answers. For business use, execution accuracy, scored with tolerances and set comparison, is the one that matters.
Is it safe to let AI run SQL on production data?
Only with a read-only database user, access limited to the tables the AI needs, and ideally a read replica so heavy queries cannot slow down the application. Never give an AI write access to a database people depend on, and keep a log of the queries it runs so you can audit what it read.
The real advantage isn't the model
The teams getting real value from AI analytics don't have a secret model. They've done something less glamorous: written down how their business works, saved the answers they trust, and tested the AI against them every week.
That's good news, because it means text-to-SQL accuracy is mostly in your control. An afternoon on definitions, a week on verified queries and evals, and the gap between demo and production shrinks fast.
The query will always run. Your job is making sure the answer is right.
We built Supaboard's AI Analyst around these four layers. You write plain-language knowledge and rules for each team. A thumbs-down becomes a rule, and approved SQL becomes a verified example. Evals grade the agent 0 to 100 against answers you know, and every answer shows its SQL. It runs read-only on your own database. Whatever tool you use, start with the checklist above. To try it on your data, Start Free.

 32 Min Read