Skip to content
Supaboard

Ask Analysts

Chat with your data

Type a question the way you'd say it out loud. You get back the chart, the numbers and the query that produced them, so you can check the answer before you act on it.

Share

John Doe • just now

Show me order count vs return count by brand.

Marketing Agent • Thought for 33s

Here’s order count against return count across your top brands.

Quick read: Saucony, Converse, and Timberland drive the most orders and also sit at the top for absolute returns. Under Armour is lowest on both.

But absolute return count is the wrong number to act on here, because returns scale with volume. The brand with the most returns is almost always just the brand with the most orders.

Three things worth flagging:

  1. The return rates are unusually tight, 11.0% to 12.6% across every brand. When rates cluster this closely regardless of brand, the driver is usually category-level, not brand quality. For footwear that almost always points to fit and sizing rather than defects.
  2. Saucony is the one to prioritize, but not because its rate is wildly off. It carries both the highest volume and the highest rate, so it accounts for roughly 18% of all returns on its own. Shaving one point off Saucony’s return rate saves more units than eliminating Puma’s returns entirely.
  3. Caveat on the chart itself: it uses two axes, so the orange (returns) bars look taller than the teal (orders) bars even though orders are about 8x larger. Worth keeping in mind before anyone reads it as “returns are close to orders.”

CHART

Order Count vs Return Count by Brand

Campa…ChannelObject
Forge…Affiliateretention
Forge…Influencerreactivation
Forge…Displayacquisition
Forge…Affiliateretention

TABLE

Campaign Wise ROI Breakdown

Related Question

Ask anything...

Acme’s Stella

Trusted by 1,000+ businesses across the world

  • Jindal Healthcare
  • Shopee
  • NetEase Games
  • Holcim
  • Publicis Sapient
  • Nilfisk
  • ClickBus
  • AAA
  • Scopely markScopely
  • FunPlus
  • Bilt
  • GlobalSign
  • Katalon
  • StockGro
  • Yami
  • Immutable
  • Plane
  • Gabriella
  • Visily
  • Poka
  • Trafilea

The question is easy. Getting the answer isn't.

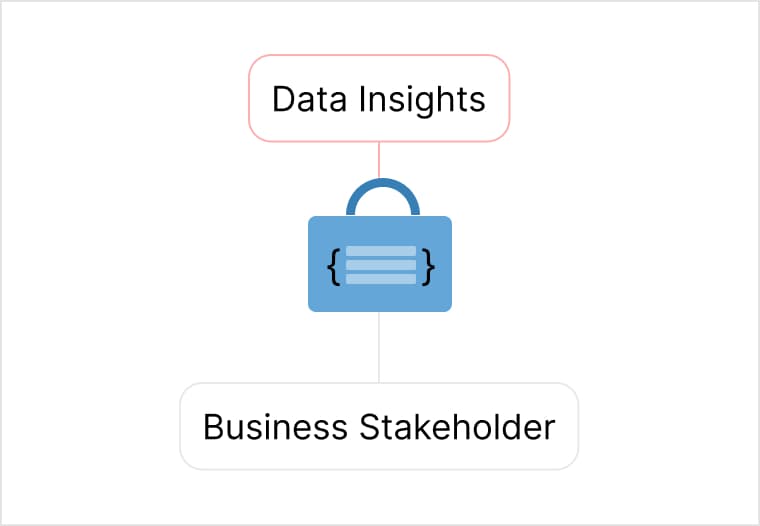
A briefcase labeled data insights locked away from a business stakeholder

You need SQL to ask anything

Everyone in the room has questions about the business. Two people in the building can write the query that answers them.
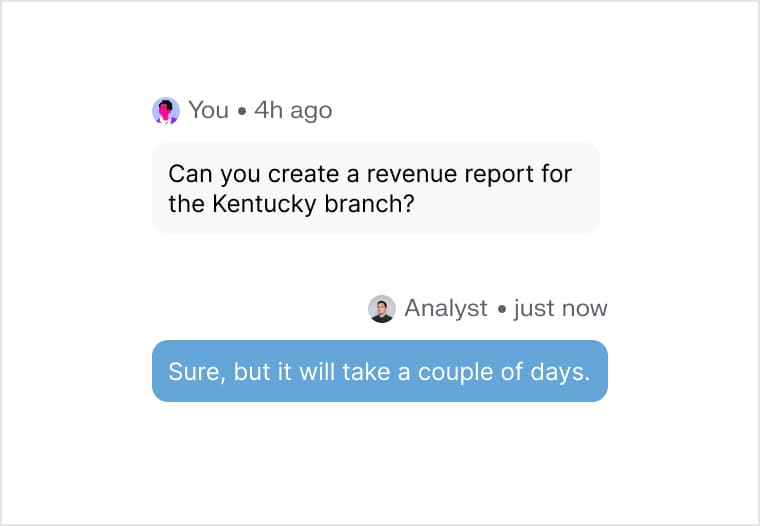
A chat thread where a data request waits days for an analyst's reply

Your answer is in someone's queue

A request that takes 30s to run waits days behind work an analyst already had.
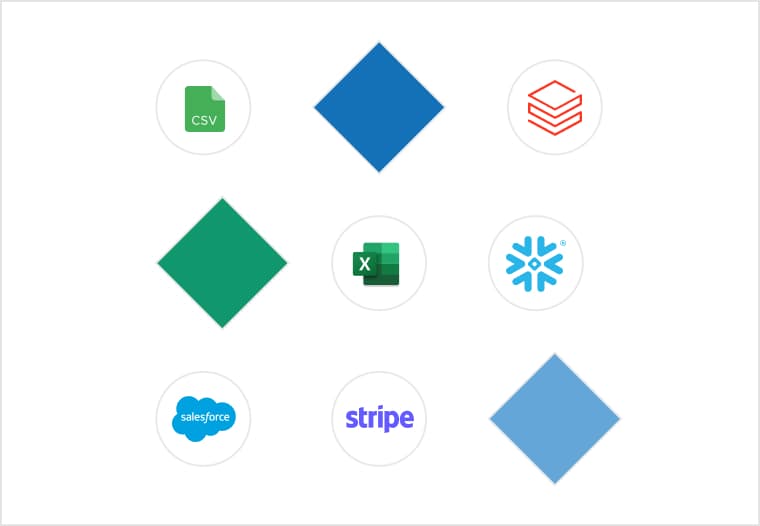
Disconnected database and platform shapes scattered across a grid

Nobody trusts a number they can't check

An answer with no query behind it gets argued about instead of acted on.

Answers you can check

Ask from the app you're already in

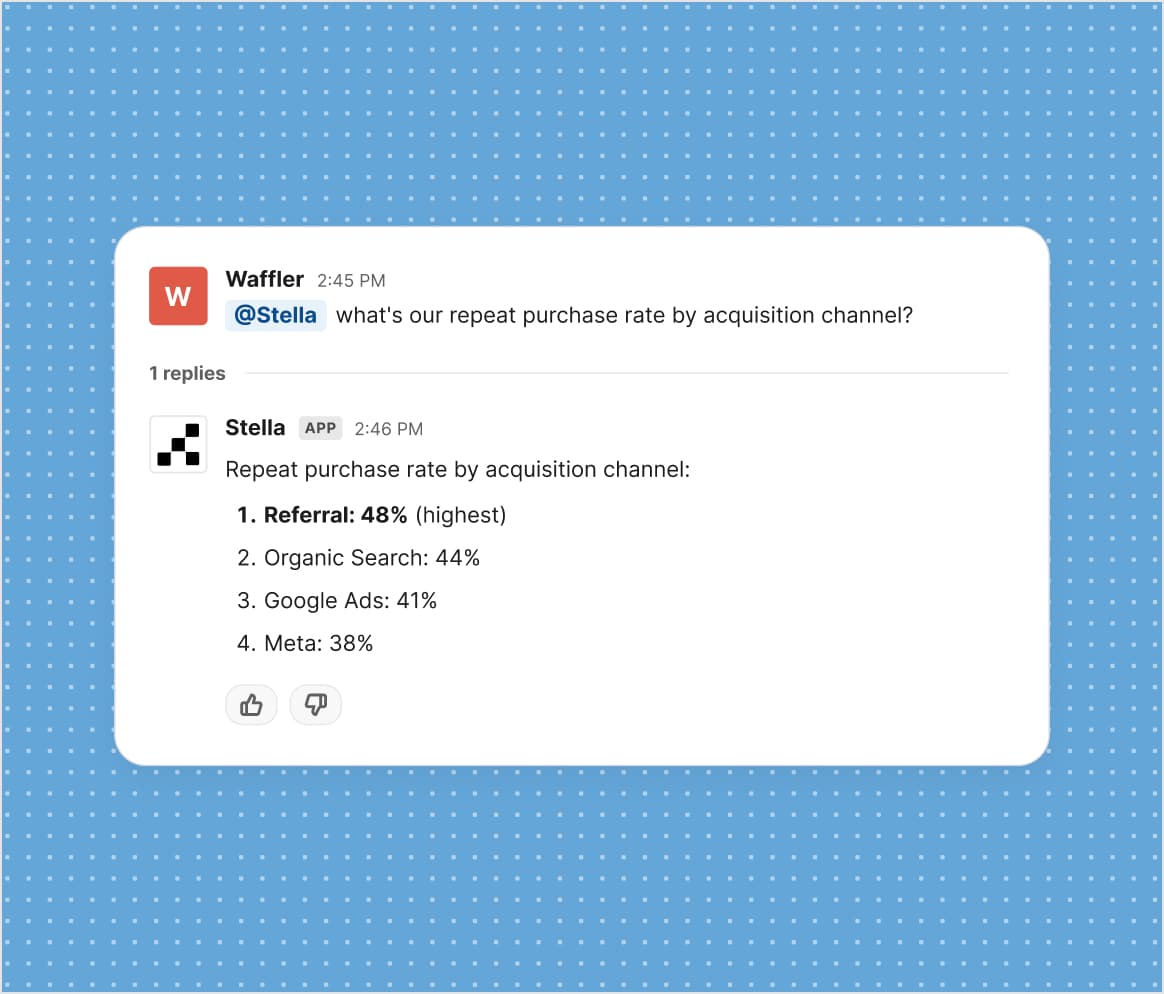
Tag the analyst in the Slack thread where the question came up and the answer lands in the thread. Claude, ChatGPT and anything else that speaks MCP reach the same analyst over the same read-only tool surface.
  • Answer in the Slack thread that asked
  • Claude, ChatGPT and any MCP client
  • Read-only, so a chat can never change your data
A Slack thread where a colleague asks the Supaboard analyst for repeat purchase rate by acquisition channel and gets the ranked answer back in the thread

Every answer carries its query

Open an answer to see the sources it read, the query it ran and the steps it took. The disagreement moves from the number to the logic, which is where it can be settled.
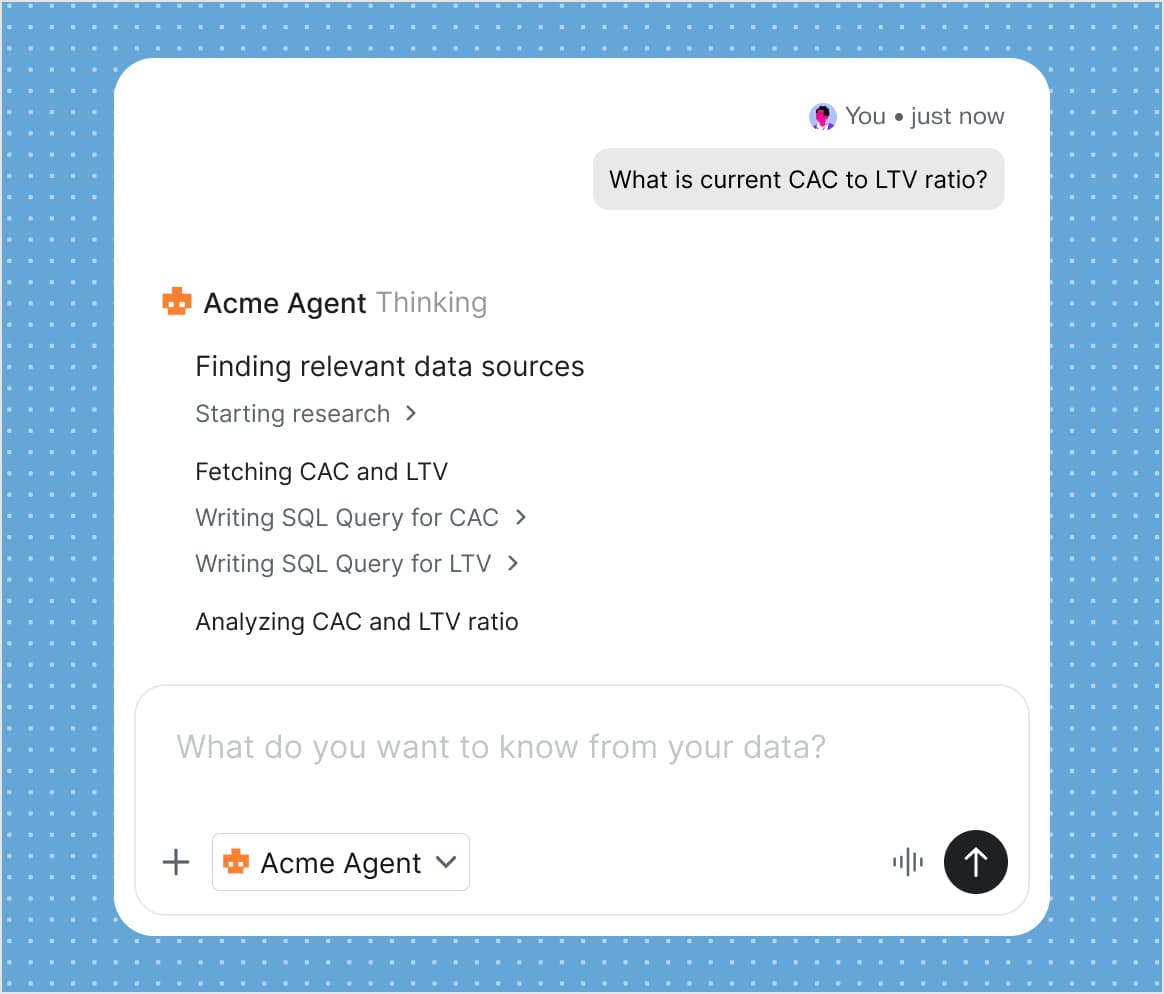
  • The SQL and Python it ran
  • A confidence score on each answer
  • Every step, in order
An analyst answering a CAC-to-LTV question with its steps open: finding sources, writing the SQL for each metric, then computing the ratio

Walk out with the deck, not the tab

The answer becomes the file the meeting needs. Ask once, get the spreadsheet, the slides or the PDF.
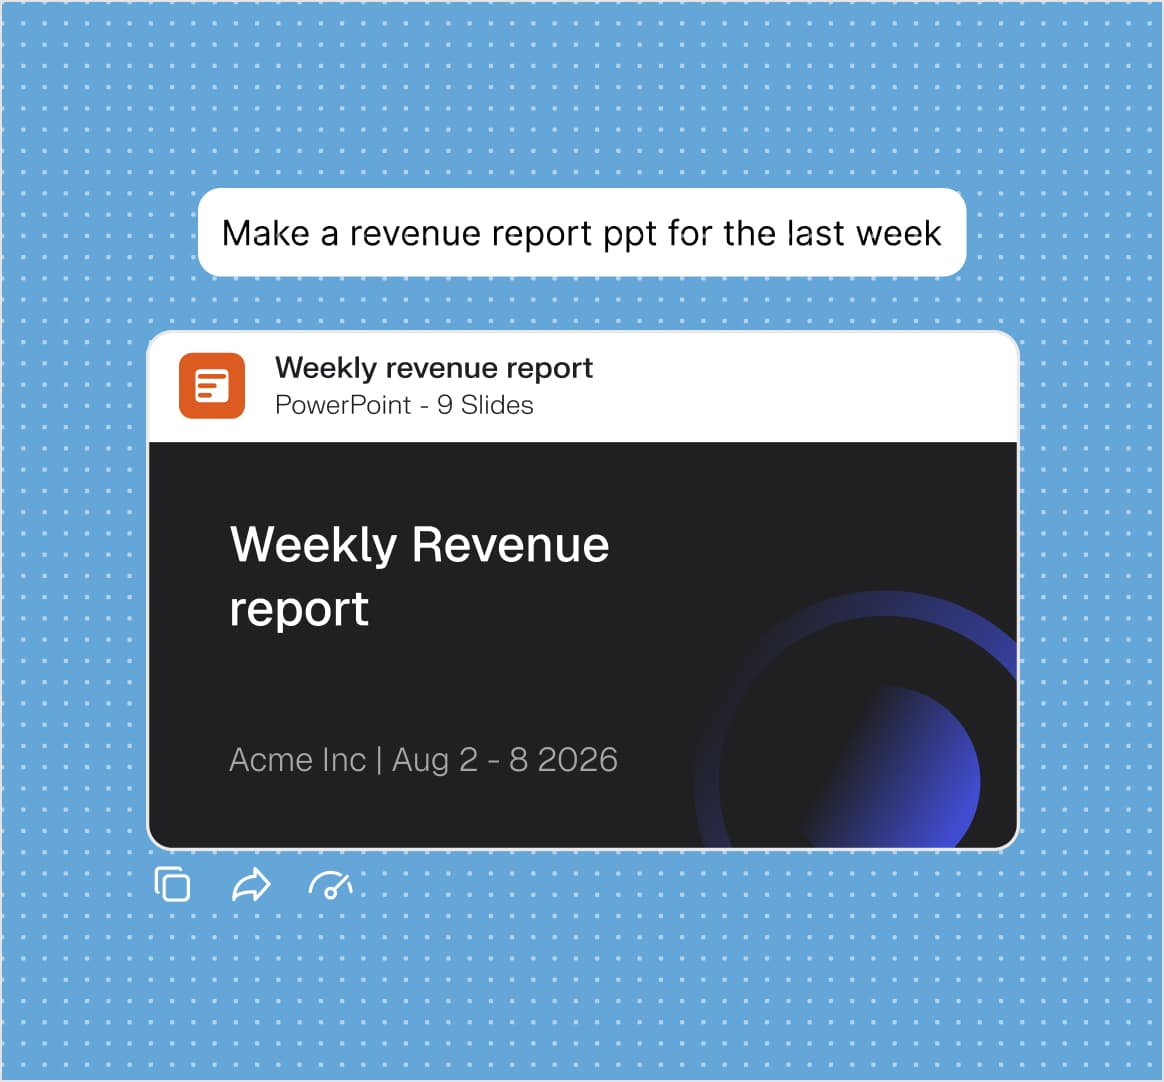
  • Excel and CSV
  • PowerPoint and PDF
  • Custom HTML pages
The prompt 'make a revenue report ppt for the last week' returning a nine-slide weekly revenue deck ready to download

What an answer costs you now

  • 40% Fewer hallucinations

    than a general-purpose model asked the same question of the same schema.

  • 99% Queries checked before they run

    are validated and auto-corrected before they touch your database.

  • 30s From question to chart

    Typical time to a finished answer, start to end.

Frequently asked questions

What is Ask Analysts?

Ask Analysts is Supaboard's chat interface for your own data. You type a question in plain English, it writes and runs the query, and it returns a chart or a table along with the SQL it used.

Do I need to know SQL?

No. You write the question, Supaboard writes the query. The SQL stays one click away for anyone who wants to read it, reuse it or argue with it.

Can I ask from Slack or ChatGPT?

Yes. Supaboard installs into Slack, and exposes the same analyst to Claude, ChatGPT and any other MCP client over its MCP server. Every one of those surfaces is read-only, so a question asked from a chat can look at your data but never change it.

How do I know the answer is right?

Every answer shows the sources it read, the query it ran and a confidence score. A tuned agent holds 97.8% accuracy in production.

How long does setup take?

About 15 minutes. Connect one source from the 700+ catalogue and ask your first question. There is no modelling step to finish first.

Your data has the answers

Start free trialBook a demo