
Retail Business Intelligence: How AI Is Transforming Retail Analytics (2026 Guide)
Discover how AI-powered retail business intelligence is transforming sales, inventory, and customer insights. Explore real use cases, tools, and implementation strategies.


Retail has never been short of data. What it has always struggled with is making that data useful, fast enough to matter.
During product demos at Supaboard, we hear the same question from retail directors and operations leads running 10 to 20-store chains: "We're sitting on months of sales data, inventory records, and customer history and we still can't get a clear answer on why revenue dropped last quarter."
That gap, between data that exists and decisions that are informed, is exactly what retail business intelligence is designed to close.
This guide is written for mid-market retail chains operating 10–20 physical stores with an e-commerce channel. If you're managing cross-channel inventory, making weekly merchandise decisions, and relying on spreadsheets or disconnected dashboards to do it, this is for you.
Industry context worth noting: McKinsey's research on a century of retail transformation found that when Marshall Field's was scaling in the 1930s, leaders "struggled to say precisely where value was being created, where it was leaking away, and who was accountable for what." Nearly 100 years later, that is still the most common problem retail operators describe to us. The tools are different. The problem is the same. (McKinsey, 2026).
Key Takeaways
The retail analytics market is valued at $6.88 billion in 2026, growing to $8.44 billion by 2031, and cloud-based platforms are making enterprise-grade BI accessible to mid-market chains for the first time
Most retail revenue problems are misdiagnosed, the data to find the real cause already exists, but it's locked in separate systems
Both offline retail and mid-market chains are significantly underserved by analytics tooling, this is a competitive advantage for those who move first
The biggest ROI from BI comes not from building dashboards, but from connecting dashboards to actual decisions
Modern retail BI should answer not just "what happened" but "what should we do about it"
What is Retail Business Intelligence?
Retail business intelligence (retail BI) is the practice of collecting, integrating, and analyzing data from across a retail operation, transactions, inventory, customers, e-commerce, and financials, to generate insights that drive faster and more accurate business decisions.
It is not a single tool. It is a capability: the organizational ability to move from fragmented, lagging data to a clear, connected view of what is happening and why and to act on it before the window closes.
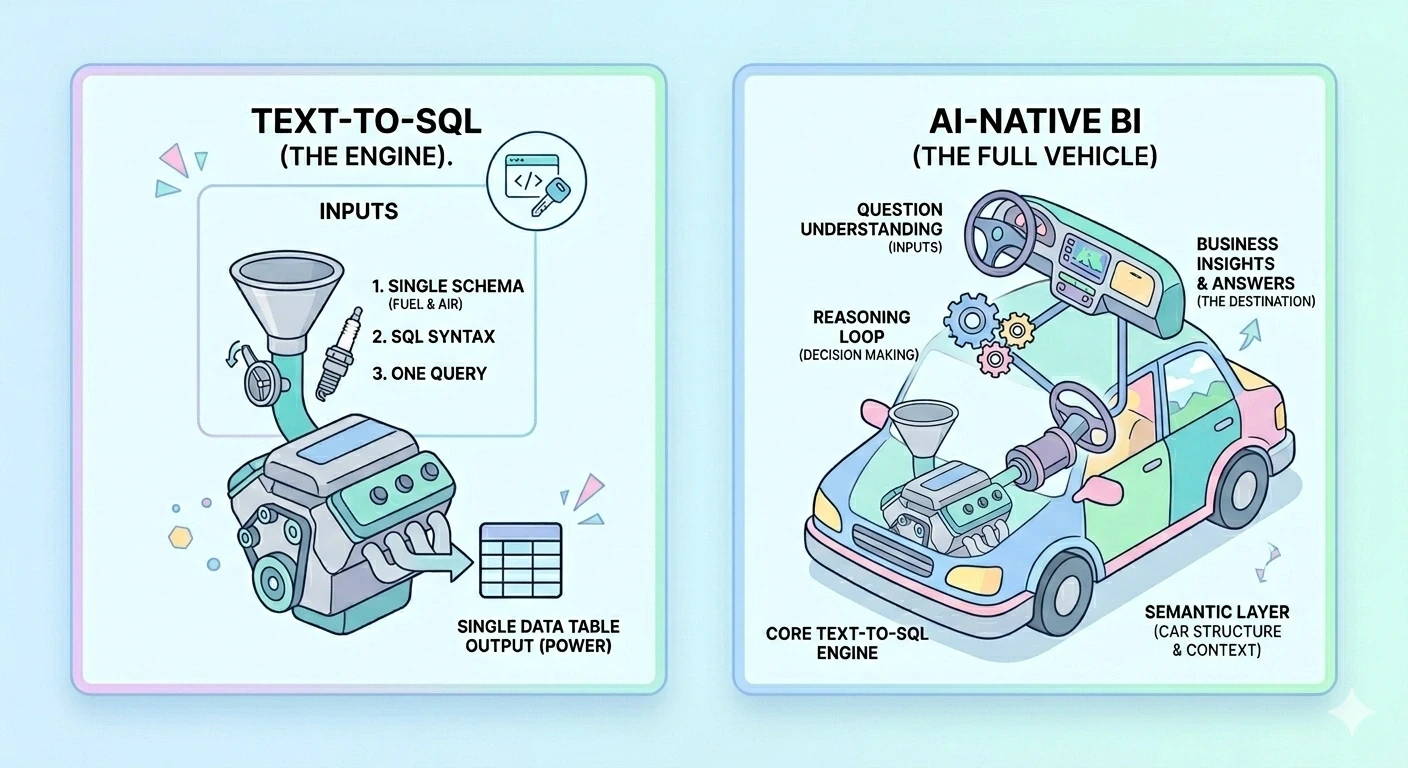
The distinction that matters: traditional BI tells you what happened. Modern retail BI tells you what to do next.
Why Retail BI Matters More Than Ever in 2026
The retail analytics market is estimated at $6.88 billion in 2026, with projections showing growth to $8.44 billion by 2031 at a 4.18% CAGR. Cloud delivery models are cutting ownership costs and trimming deployment cycles, which allows mid-tier chains to access capabilities once limited to global leaders.
Three forces are making BI a necessity rather than a competitive differentiator:
1. Omnichannel complexity is outpacing manual processes. Managing inventory, pricing, and customer experience across 10–20 stores and an e-commerce channel generates data volumes that spreadsheets and weekly reports simply cannot process fast enough for operational decisions.
2. Margins are too tight to get decisions wrong. Every overstock event, every stockout, every misallocated promotion budget has a direct P&L consequence. In a low-margin environment, decisions made on incomplete information are expensive.
3. AI-powered insights are no longer enterprise-only. Real-time personalization, prescriptive inventory tools, and advanced promotion optimization are lifting conversion rates and order profitability even as margins tighten. Competitive advantage is shifting toward platforms that integrate predictive, prescriptive, and generative capabilities, signaling that analytics has moved from a discretionary spend to a fundamental retail requirement.
Here is the operational gap BI closes:
Without Retail BI | With Retail BI |
|---|---|
Weekly reports built manually in spreadsheets | Automated dashboards refreshed in real or near-real time |
Data isolated across POS, CRM, inventory, e-commerce | All sources integrated into a single analytical environment |
Decisions based on top-line revenue and experience | Decisions supported by product-, store-, and segment-level analysis |
Promotions designed by convention and calendar | Promotions measured against margin impact and historical outcomes |
Inventory problems found after revenue is already lost | Inventory risks flagged proactively through threshold alerts |
Monthly financial reviews as the primary feedback loop | Daily operational visibility across all stores and channels |
What Data Does Retail BI Analyze?
Most mid-market retail chains already have all the data they need. The problem is that it lives in five or six different systems that were never designed to work together.
Data Source | What It Captures | Why It Matters for BI |
|---|---|---|
POS / Transaction Systems | Sales by SKU, store, associate, time, payment method | Foundation for sell-through analysis, store benchmarking |
E-commerce Platform | Orders, traffic, conversion, returns, channel mix | Cross-channel inventory and revenue analysis |
Inventory Management | Stock levels, reorder points, sell-through rates, lead times | Stockout prevention, overstock identification |
CRM | Purchase history, loyalty data, churn signals | Customer retention, segment-level analysis |
Marketing Platforms | Campaign performance, spend, attribution by channel | Promotion ROI, marketing efficiency |
Financial Systems | Revenue, gross margin, COGS, operating expenses | Profitability by store, category, channel |
External Data | Seasonality, local events, weather, competitor signals | Demand forecasting accuracy |
The data fragmentation problem is real and consistently underestimated. In our experience working with mid-market chains, the integration audit, mapping what data exists and where, regularly uncovers both data that exists but isn't being used, and gaps where important signals are simply not being captured.
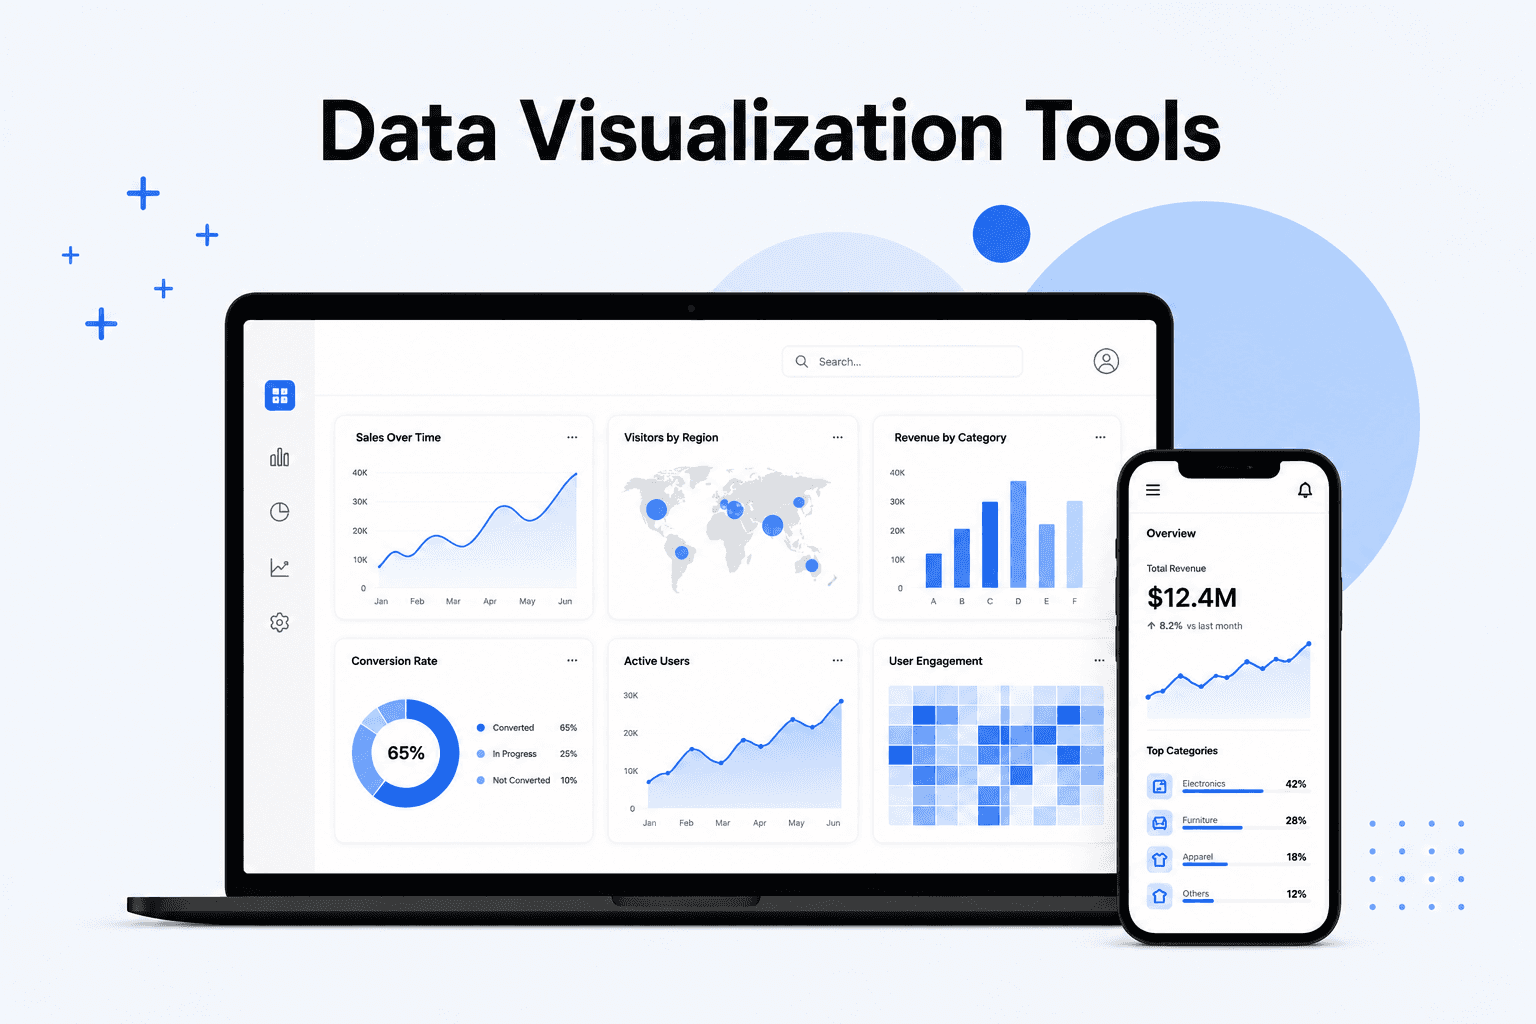
Retail BI Dashboards: What They Should Actually Show
This is the section most BI guides skip entirely, and it's where implementation either succeeds or fails.
A retail BI dashboard is only valuable if it answers questions people are actually asking. Building dashboards around data availability rather than decision requirements is the most common implementation failure we see.
Here is what effective retail BI dashboards look like by function:
Executive / Leadership Dashboard
Total revenue vs. target (by week, month, rolling quarter)
Gross margin by store and channel
Sell-through rate by category
Inventory turnover ratio
Top 10 and bottom 10 SKUs by contribution margin
Merchandising / Buying Dashboard
SKU-level sell-through rate by location
Days-on-hand by product category
Overstock and understock alerts (threshold-based)
Demand forecast vs. actual by SKU
Markdown performance and margin impact
Store Operations Dashboard
Store-level revenue vs. comparable peers
Conversion rate and average basket size by location
Staff productivity metrics where applicable
In-store vs. online channel mix by region
Marketing Dashboard
Promotion uplift vs. baseline (incremental revenue only)
Customer acquisition cost by channel
Repeat purchase rate by segment
Loyalty program engagement and churn signals
From our experience: The most effective dashboards we have helped teams build show 5–7 metrics maximum per view. When a dashboard shows everything, it answers nothing. The best signal that a dashboard is working is that it triggers a specific action, not just a review meeting.
Key Retail KPIs to Track in Your BI System
A retail BI system without clearly defined KPIs is a data warehouse, not a decision engine. These are the metrics that should be actively tracked, not just available.
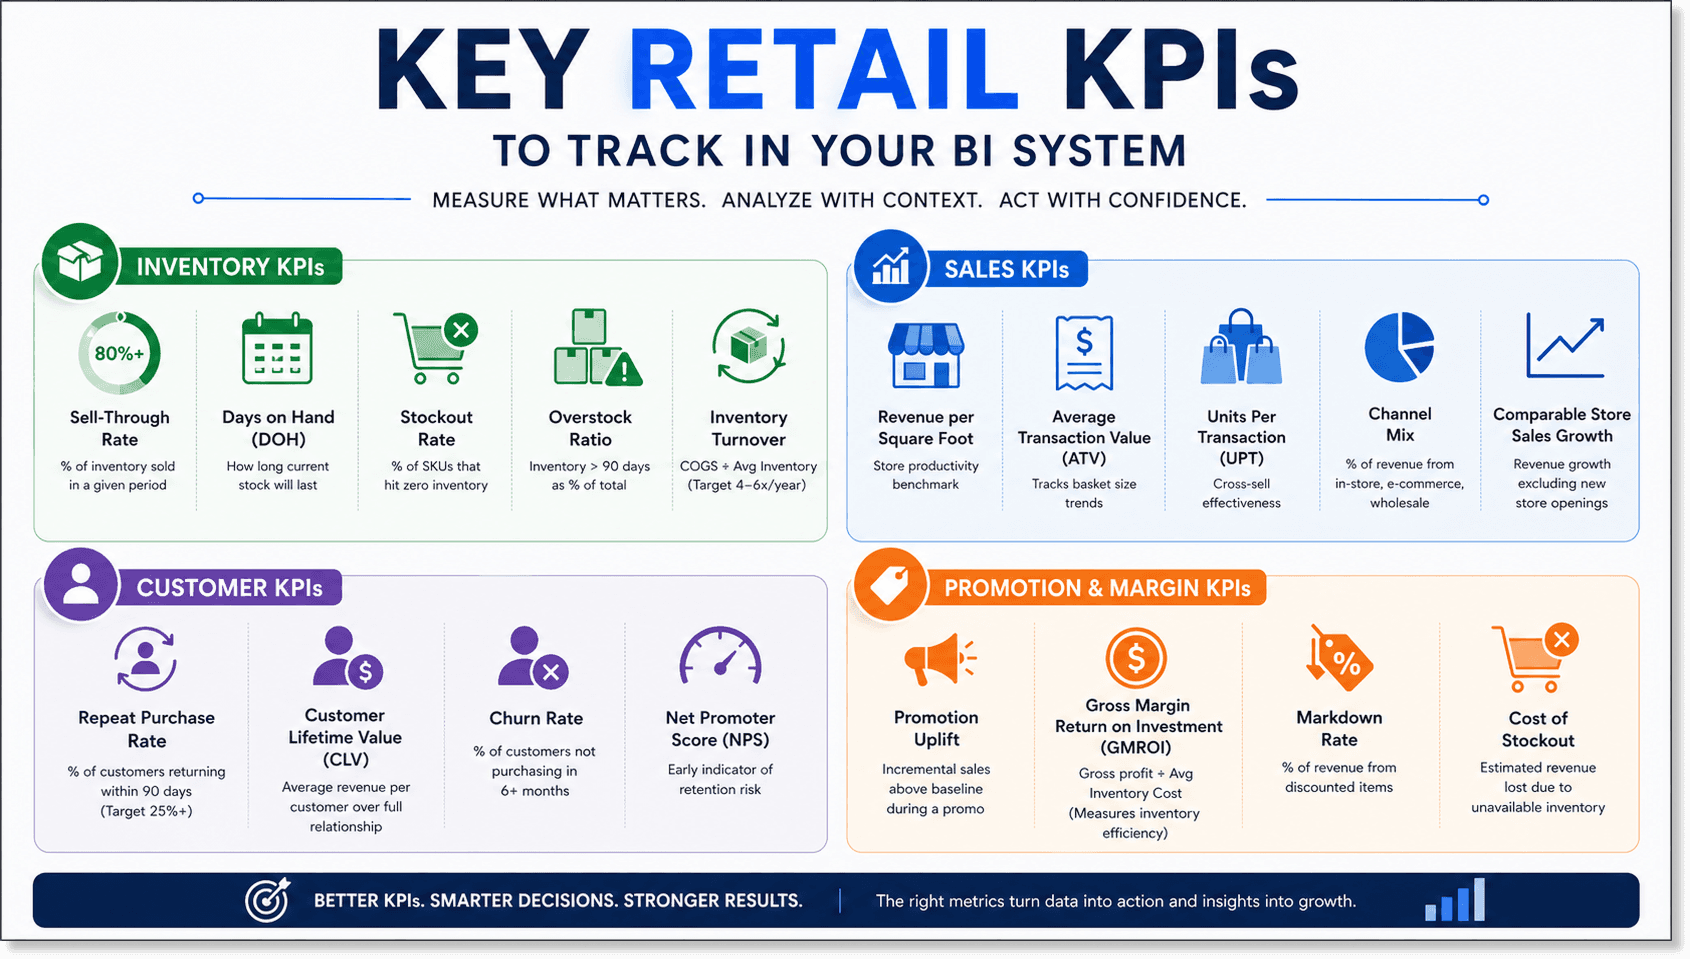
Inventory KPIs
Sell-Through Rate: % of inventory sold in a given period; target varies by category but 80%+ is healthy for fashion
Days on Hand (DOH): How long current stock will last at current sales velocity; alerts needed when DOH falls below reorder lead time
Stockout Rate: % of SKUs that hit zero inventory; above 5% indicates systemic issues
Overstock Ratio: Inventory held beyond 90 days as a % of total; directly tied to markdown pressure
Inventory Turnover: COGS ÷ Average Inventory; benchmark 4–6x annually for mid-market fashion
Sales KPIs
Revenue per Square Foot: Especially relevant for physical store benchmarking
Average Transaction Value (ATV): Tracks basket size trends over time
Units Per Transaction (UPT): Cross-sell effectiveness indicator
Channel Mix: % of revenue from in-store vs. e-commerce vs. wholesale
Comparable Store Sales Growth: Revenue growth excluding new store openings
Customer KPIs
Repeat Purchase Rate: % of customers returning within 90 days; below 25% signals retention issues
Customer Lifetime Value (CLV): Average revenue per customer over their full relationship
Churn Rate: % of customers who have not purchased in 6+ months
Net Promoter Score (NPS): Combined with behavioral data, an early indicator of retention risk
Promotion & Margin KPIs
Promotion Uplift: Incremental sales above baseline during a promotional period
Gross Margin Return on Investment (GMROI): Gross profit ÷ Average Inventory Cost; directly measures inventory efficiency
Markdown Rate: % of revenue from discounted items; high rates signal overstock or poor demand forecasting
Cost of Stockout: Estimated revenue lost due to unavailable inventory
Retail BI Use Cases: Problem, Insight, Impact
1. Inventory Optimization
The problem: Simultaneously carrying too much of the wrong stock and too little of the right stock is among the most costly and common failures in mid-market retail. The financial consequences compound in both directions, overstock generates markdown pressure and ties up working capital, while stockouts suppress revenue and accelerate customer churn.
What BI reveals: Sell-through rates, days-on-hand, and restock velocity tracked at the SKU level across all locations. Integrated with customer data, this surfaces whether a revenue decline reflects falling demand or operational execution failures, two problems that require completely different responses.
Case Study: US Fashion Retail Chain (12 Stores + E-commerce):
A mid-sized fashion retailer reported a sustained 18% drop in monthly revenue over two consecutive quarters. Internal analysis pointed to reduced footfall, a diagnosis that would have driven investment in store experience and marketing.
A BI-led investigation produced an entirely different finding.
Product-level analysis showed 32% of inventory was slow-moving, primarily seasonal items overstocked from poor demand forecasting. Simultaneously, high-demand products were selling out within 3–5 days of each restock, creating consistent and recurring missed-sales windows.
Customer data confirmed the damage: repeat purchase rates had dropped 12% over the same period, driven by frequent unavailability of popular sizes and colorways. Promotion analysis revealed most discount activity was concentrated on already-declining products, reducing margins without recovering volume.
The revenue decline was not a demand problem. It was an inventory execution problem.
What they did: Reduced low-performing SKUs by 25%, reallocated stock toward high-velocity items, revised the replenishment model.
Results within six weeks: Stockouts down 40%. Sales up 14%. Profit margins improved 8 percentage points.
The principle: Revenue loss in retail is frequently misattributed. BI enables leadership to distinguish between demand decline and operational failure, and to apply the correct intervention. In our work with multi-location chains, we've seen clients reduce overstock by 20–30% within the first 60 days simply by connecting their POS and inventory data in one view.
2. Demand Forecasting
The problem: Buying decisions are made weeks or months before products reach the floor. Without structured forecasting, chains default to last year's numbers, which fail whenever conditions shift seasonally, competitively, or economically.
What BI reveals: Historical sales patterns at the SKU level, seasonality curves, promotional lift, and early demand signals from e-commerce and search behavior before they show up in-store.
Real-world benchmark: Zara's parent company Inditex uses near-real-time sales analytics to adjust production and allocation within weeks rather than months, achieving inventory turn rates significantly faster than industry peers. Their ability to move from trend detection to floor availability in under three weeks is driven entirely by data infrastructure, not design speed alone. (McKinsey on Inditex)
Impact for mid-market chains: More accurate purchase orders, less end-of-season markdown pressure, replenishment cycles tied to actual sell-through rather than calendar assumptions.
3. Customer Segmentation and Retention
The problem: Transaction records tell you who bought something. They don't tell you why loyal customers are buying less, which segments generate disproportionate lifetime value, or which customers are 30 days from churning.
What BI reveals: Purchase frequency trends, basket size by segment, repeat purchase decay curves, and behavioral churn signals — the drop in visit frequency that precedes cancellation or disengagement, visible in the data weeks before it shows up in revenue.
Real-world example: Sephora's Beauty Insider program is one of the most cited loyalty analytics cases in retail. By connecting transaction history to behavioral segmentation, Sephora drives personalized recommendations and targeted retention offers, resulting in repeat purchase rates that consistently outperform industry benchmarks. Their BI infrastructure, not their loyalty program mechanics, is what makes this scalable. (Retail Dive)
Impact: Retention spend directed at high-value segments with measurable churn risk. Promotions matched to actual purchase behavior rather than broad demographic assumptions.
4. Store Performance Benchmarking
The problem: Average revenue figures across a 15-store chain can look healthy while 4 or 5 locations are structurally underperforming. Without store-level BI, you're applying the same decisions to problems with different causes.
What BI reveals: Store-level performance against matched peers (comparable format, footfall, market size), category mix differences that explain divergence, and operational variables, staffing patterns, local assortment gaps, conversion rate differences, that separate underperformance from situational variance.
From our experience: When we help chains set up their first store-level benchmarking view, the most common immediate finding is that 2–3 stores consistently underperform matched peers by 15–20%, and that the gap is explained not by location or footfall but by inventory allocation. The right products simply aren't being stocked at the right locations. This is only visible when store data is analyzed comparatively, not in isolation.
5. Promotion Effectiveness and Pricing Intelligence
The problem: Promotions are expensive. Discounting the wrong products, at the wrong depth, in the wrong periods, destroys margin without generating incremental revenue. Many mid-market chains run promotions by calendar habit rather than evidence.
What BI reveals: Margin impact per promotion event, incremental volume (sales that would not have occurred at full price) vs. pull-forward volume (sales that would have happened anyway), and price elasticity by segment and category.
Real-world example: Walmart's analytics infrastructure runs continuous A/B testing on promotional mechanics and pricing across store clusters, enabling dynamic adjustments based on real-time performance rather than pre-season planning alone. (Harvard Business Review)
In product demos with mid-market chains, the promotion analysis is consistently the finding that creates the most immediate urgency. Many retailers discover for the first time that a significant share of their discount spend is concentrated on products that were already in decline, accelerating margin erosion with no volume recovery. This finding alone typically pays for the cost of BI implementation.
Explore top BI tools in 2026 and find the best solution for smarter business decisions.
Traditional BI vs. Modern Retail BI: What's the Difference?
This distinction matters because many mid-market chains have some form of reporting already, and assume it counts as BI.
Dimension | Traditional / Legacy BI | Modern Retail BI |
|---|---|---|
Data refresh | Weekly or monthly, manual | Real-time or near-real-time, automated |
Scope | Usually one system (POS or finance) | All systems connected — POS, inventory, CRM, e-commerce |
Question answered | "What happened last month?" | "What is happening now, and what should we do?" |
User | Data analyst or finance team | Merchandisers, store ops, marketing, no analyst needed |
Alerts | None, requires manual review | Automated alerts when thresholds are breached |
Forecasting | Historical averages | Predictive models incorporating seasonality, promotions, trends |
Time to insight | Days to weeks | Minutes to hours |
Implementation | 6–18 months, requires IT | Weeks, built for operators |
McKinsey's research highlights that agentic AI in retail merchandising can free up to 40% of merchants' time currently spent on manual analysis, shifting that capacity toward strategic decisions. That shift, from analyst-dependent reporting to operator-accessible intelligence, is what separates modern retail BI from legacy tools.
The Offline Retail Analytics Gap: An Honest Assessment
Here is something worth naming directly, because it comes up in almost every product demo we run with physical-first retailers.
The analytics tooling market has built deep, sophisticated infrastructure for pure-play e-commerce. Digital-native retailers have real-time behavioral data, A/B testing frameworks, funnel analytics, and personalization engines, all built for the digital channel.
For brick-and-mortar retail, physical stores, multi-location chains, offline-first businessesm, the tooling is far more limited. Basic inventory management exists. Advanced analytical tools that help store operators understand in-store performance, diagnose revenue problems, and make data-driven decisions? That gap is real, and it is consistently underserved.
Pure-play e-commerce retailers held 59.30% of retail analytics deployments in 2025, while brick-and-mortar stores represent a significantly smaller share of current adoption.
Two questions worth considering:
Is the gap because physical retailers don't know these tools exist, or because the analytics industry has focused on where data is easiest to collect (digital channels) and has underinvested in solving the harder problem of offline intelligence?
In our view, it's both. And for mid-market chains that operate primarily through physical stores, getting ahead of this gap now, before it becomes a baseline expectation, is a genuine, time-limited competitive advantage.
How to Implement Retail BI: A Practical Roadmap
Effective implementation follows a defined sequence. Teams that deploy dashboards before establishing data infrastructure, or that build BI without aligning on the decisions it must support, consistently underdeliver on the investment.
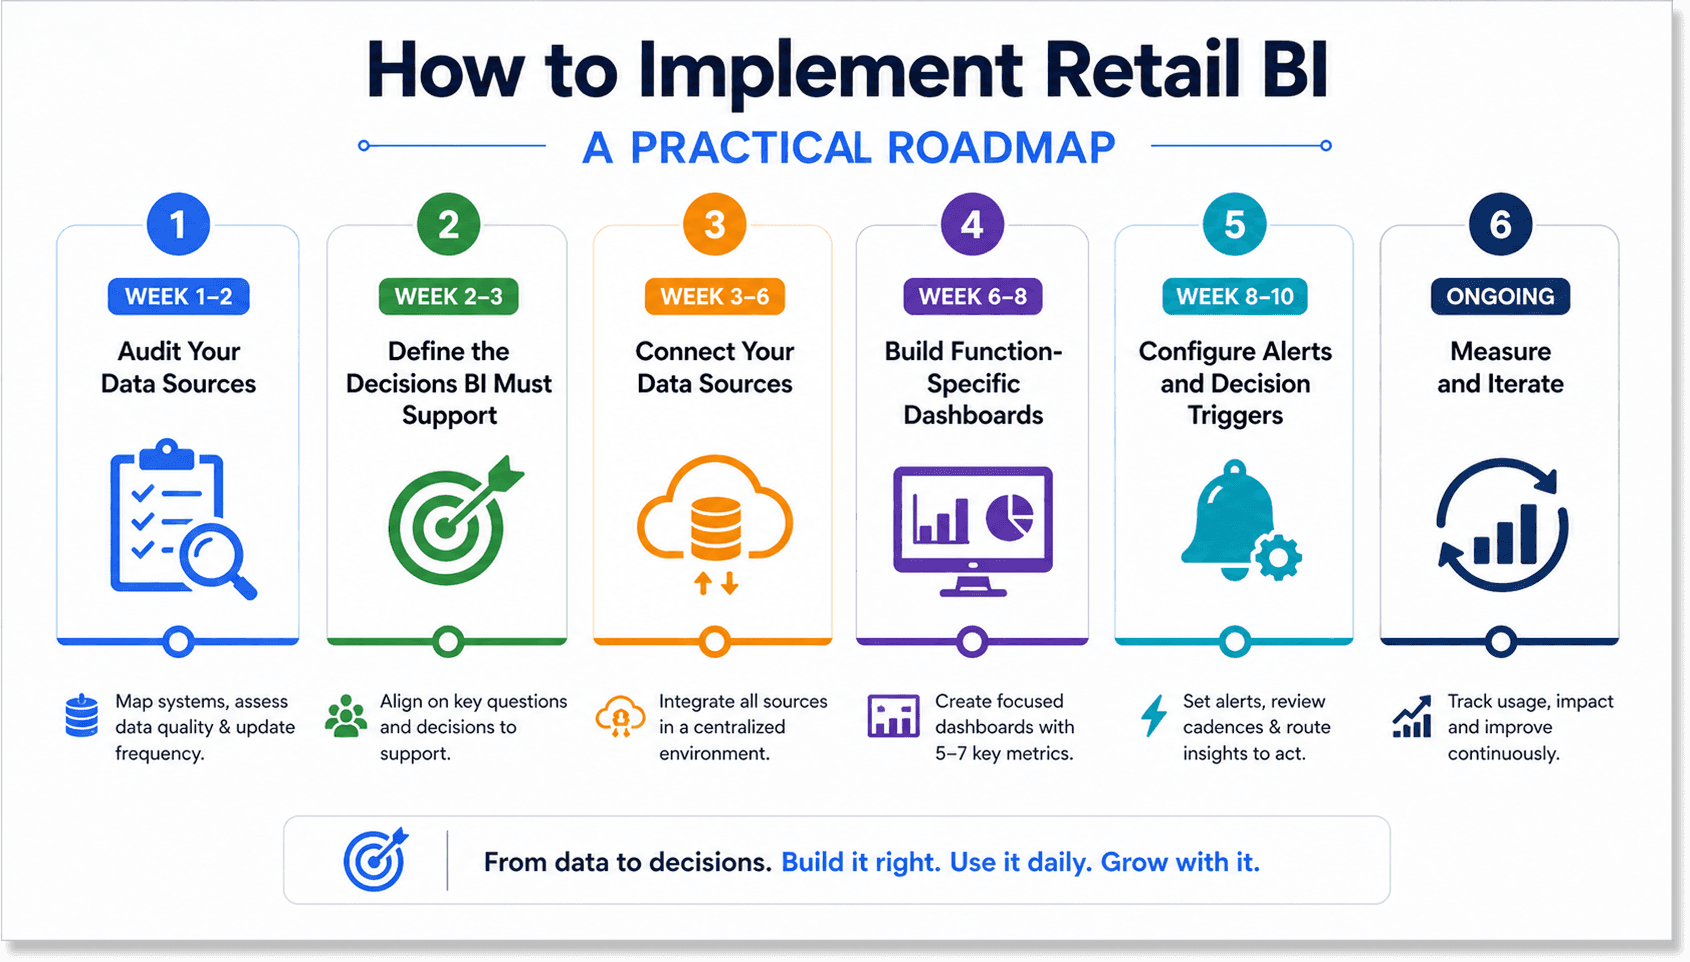
Step 1: Audit Your Data Sources (Week 1–2)
Map every system in your current stack: POS, e-commerce platform, inventory management, CRM, financial systems. Document what each captures, data quality, and update frequency. This audit almost always surfaces both unused data and collection gaps.
Connect all your tools instantly and turn scattered data into unified insights that power smarter, faster business decisions with Supaboard
Step 2: Define the Decisions BI Must Support (Week 2–3)
Before building anything, align on the specific operational questions BI should answer. What does the inventory team need to see each morning? What does leadership review weekly? What signals would trigger a store visit or a buying decision?
This step prevents the most common failure mode: dashboards built around data availability that no one uses because they don't answer real questions.
Step 3: Connect Your Data Sources (Week 3–6)
Establish a centralized environment, whether a cloud data warehouse, a BI platform with native connectors, or a managed integration layer, where all sources can be queried together. Modern platforms handle most of this through pre-built integrations, reducing the need for custom engineering.
Step 4: Build Function-Specific Dashboards (Week 6–8)
Build separate views for merchandising, store operations, finance, and marketing. Each should surface 5–7 metrics relevant to that team's daily decisions, not a comprehensive view of everything available. Complexity in dashboards reduces adoption, not increases value.
Step 5: Configure Alerts and Decision Triggers (Week 8–10)
Connect BI outputs to operational workflows: automated alerts for stockout thresholds, weekly review cadences anchored to dashboards, anomaly routing to the right decision-makers with enough context to act. This is where BI moves from reporting infrastructure to operational infrastructure.
Step 6: Measure and Iterate (Ongoing)
Track whether dashboards are being used, whether the decisions they inform are improving, and where new questions are emerging. BI implementation is not a project with an end date, it is an ongoing capability that should grow with your business.
Common Mistakes in Retail BI Implementation
Both competitors and most BI guides skip this section. That is exactly why it is worth covering in detail.
Mistake 1: Building dashboards before defining decisions The most expensive mistake in BI is investing in infrastructure before answering: what specific decisions should this change? Dashboards built around data availability rather than decision requirements get reviewed once and abandoned.
Mistake 2: Starting with too many KPIs More metrics do not produce more insight. They produce more noise. Start with 5–7 metrics per function, selected because they directly connect to a decision someone makes regularly. Add metrics only when a specific decision need requires them.
Mistake 3: Treating BI as an IT project BI implementation that is owned by the technology team rather than the business team almost always produces technically correct dashboards that no one in operations uses. The primary owner must be the function that will make decisions with the data.
Mistake 4: Using weekly data for daily decisions Inventory and sales decisions made on data that is 48–72 hours stale carry real operational risk. Establishing data freshness requirements before platform selection, not after is essential.
Mistake 5: Assuming the first diagnosis is correct The most valuable thing BI enables is not confirming your existing assumptions, it is challenging them. The fashion retailer in the case study above assumed footfall decline was the problem. The data showed it was inventory imbalance. Teams that use BI to confirm what they already believe are paying for sophisticated confirmation bias.
Mistake 6: Neglecting offline store data Many BI implementations prioritize e-commerce data because it is cleaner and more accessible. Physical store data, which represents the majority of revenue for most mid-market chains, gets deprioritized or excluded. This creates a distorted view of business performance that leads to systematically wrong decisions about inventory allocation and store investment.
How to Choose the Right Retail BI Tool
Criteria | What to Look For | Red Flags |
|---|---|---|
Pre-built connectors for your POS, e-commerce, and ERP | Requires custom API work for standard integrations | |
Data freshness | Real-time or hourly refresh | Daily or weekly refresh only |
User accessibility | Non-technical users can build and read dashboards | Requires analyst support for every query |
Retail-specific features | Inventory KPIs, sell-through tracking, demand forecasting built in | Generic BI requiring configuration for retail use cases |
Implementation timeline | Weeks to first value | Months of setup before first dashboard |
AI / anomaly detection | Proactive alerts, not just on-demand queries | Purely descriptive — no forward-looking capability |
Scalability | Handles growth in store count and data volume without re-implementation | Fixed-capacity pricing that penalizes growth |
Where Supaboard fits: Supaboard is built specifically for mid-market retail chains, pre-built integrations with the most common retail stacks, dashboards designed for operators rather than analysts, and a setup timeline measured in weeks rather than months. If you're evaluating options, see how it compares for your specific stack →
Retail BI Tools Compared
Platform | Best For | Strengths | Limitations |
|---|---|---|---|
Supaboard | Mid-market retail chains (10–30 stores + e-com) | Fast setup, retail-native, operator-accessible | Growing feature set |
Tableau | Enterprise with large data teams | Deep visualization, flexible | High cost, requires analyst |
Microsoft Power BI | Microsoft-stack organizations | Strong integration with D365, Excel | Complex for non-technical users |
Domo | Enterprise operations | Broad data connectors, strong mobile | Expensive, enterprise-focused |
Looker | Data-mature organizations | Powerful querying, developer-friendly | Requires technical resources |
Benefits of Retail Business Intelligence
Revenue recovery: Inventory optimization and stockout reduction directly restore missed sales; our clients typically see 10–20% improvement in first 90 days
Margin protection: Identifying which products, promotions, and channels are destroying value before the financial impact compounds
Faster decision cycles: From monthly reporting to real-time or daily visibility across all stores and channels
Working capital efficiency: Less overstock means less capital tied up in slow-moving inventory; typical improvement of 15–25% in overstock ratio within 60 days
Customer retention: Identifying churn signals before attrition occurs, enabling targeted intervention
Organizational alignment: All functions operating from a single, consistent view of performance rather than competing spreadsheet extracts
The Future of Retail BI: What's Coming in 2026–2028
The direction is clearly established: retail analytics is moving from describing what happened to recommending what to do next, automatically.
McKinsey's research on agentic AI in retail merchandising highlights how autonomous decision engines can free up to 40% of merchants' time for more strategic priorities, while their latest thinking around agentic commerce delineates six levels of automation that are redefining the shopping experience.
For mid-market chains, the practical near-term implications are:
Automated demand forecasting: Systems that update predictions from real-time sell-through data, not quarterly planning cycles
Prescriptive inventory management: Platforms that don't just flag stockout risk but recommend the specific reorder quantity and timing
AI-generated promotion recommendations: Discount decisions driven by live inventory and demand signals rather than pre-season calendars
Unified omnichannel intelligence: Seamless analysis across physical stores, e-commerce, and wholesale in a single environment
AI/ML advances for real-time prescriptive insights are projected to add 1.0% to CAGR, with North America and advanced Asia-Pacific markets leading adoption over a 4+ year horizon.
These capabilities are not five years away. They are available now in mid-market platforms. The question is not whether to adopt them — it is which organizations will build the data infrastructure that makes them possible before their competitors do.
Conclusion
The retailers that outperform in the next three to five years will not necessarily have better products, better locations, or larger marketing budgets than their competitors. They will have better information, and they will act on it faster.
The mid-market chain in our case study did not need new data. Every signal, inventory imbalance, stockout frequency, declining repeat purchase rates, misallocated discount spend, was present in systems they already owned. What was absent was the infrastructure to see those signals together, and the operational framework to act on them.
That is what retail business intelligence delivers at its best: not more complexity, but more clarity. Not more dashboards, but better decisions.
If you are evaluating where to start, the most practical first step is straightforward: map the data you already have, identify three to five decisions your team makes weekly on insufficient information, and find a tool that connects the two. The gap is smaller than it looks. The payoff is larger than most teams expect.
Ready to see what this looks like for your specific store setup? Request a Supaboard demo → we typically identify the first high-value BI opportunity within the first 30 minutes of your current data setup.
Frequently Asked Questions
What is retail business intelligence?
Retail business intelligence is the process of collecting, integrating, and analyzing data from across a retail operation, stores, e-commerce, inventory, customers, and finances, to generate insights that drive faster and more accurate business decisions. It combines data infrastructure, analytical tooling, and operational workflows designed around specific retail decision needs.
How is BI used in retail?
Retailers use BI for inventory optimization, sales performance benchmarking, demand forecasting, customer retention analysis, and promotion effectiveness measurement. In practice, this means dashboards that consolidate multiple data sources into role-specific views, with automated alerts that trigger operational responses before problems become expensive.
What are the key KPIs in a retail BI system?
The most important retail BI KPIs include sell-through rate, days-on-hand, stockout rate, inventory turnover, comparable store sales growth, repeat purchase rate, gross margin return on investment (GMROI), and promotion uplift. The right KPI set depends on the decisions each function makes regularly.
What makes a good retail BI dashboard?
An effective retail BI dashboard shows 5–7 metrics maximum per function, updates in real or near-real time, connects directly to decisions the viewer makes regularly, and includes threshold-based alerts rather than just static displays. Dashboards built around data availability rather than decision requirements are the most common cause of low adoption.
What are the best retail BI tools for mid-market chains?
Mid-market chains with 10–20 stores commonly evaluate Supaboard, Looker, and Power BI. The key criteria are: pre-built integrations with your existing POS and e-commerce stack, real-time or near-real-time data refresh, and accessibility for non-technical operational teams. Enterprise platforms like Tableau and Domo are powerful but typically require dedicated data resources to maintain.
What are the benefits of retail BI?
The primary benefits are revenue recovery through better inventory and promotion decisions, margin improvement through early identification of value-destroying patterns, faster decision-making through real-time data visibility, improved working capital efficiency, and stronger customer retention through behavioral analytics.
How does BI improve inventory management?
Retail BI connects POS data, inventory records, and historical demand patterns to surface stockout risks, overstock positions, and slow-moving SKUs before they generate financial impact. Combined with demand forecasting, it improves buying decisions upstream of the trading period, reducing both the markdown pressure from overstock and the revenue loss from understock.


