
What Is an Ecommerce Dashboard? Metrics, Benefits & Best Practices
Understand ecommerce dashboards, key metrics, and benefits. Learn how to build one, overcome challenges, and choose the best tools for smarter decisions.


Introduction
An ecommerce dashboard lets online firms analyze performance, review KPIs and make faster data-driven decisions. It’s a powerful tool.” A modern dashboard for an ecommerce site brings together data on revenue, consumer behavior, campaign performance, and operational metrics into a single unified view. Many firms still rely on fragmented reports. Smart ecommerce dashboards and reporting solutions distill complicated data into actionable insights that improve productivity, collaboration, and scalable growth plans across teams.
What Is an Ecommerce Dashboard?
An ecommerce dashboard is a visual analytics tool that brings together data from a variety of sources, ecommerce systems, analytics tools, CRMs, and advertising platforms, into a single, unified interface. Teams don’t have to manually sift through disparate information, they can leverage dashboards to get a comprehensive view of performance and find actionable insights quickly and efficiently.
Traditional analytics tools tend to look more at past data whereas current dashboards are more about real-time monitoring and insights that look forward. A good dashboard for an ecommerce site user would include revenue performance, customer trends, marketing efficacy, and operational indicators in a way that makes it easy to analyze and make business decisions.
Why Ecommerce Dashboards Matter for Store Growth
An effective ecommerce dashboard is a must to provide agility, visibility and strategic planning for firms. Dashboards bring together essential information in one place, enabling teams to find opportunities faster, minimize inefficiencies, and make data-driven decisions aligned with corporate objectives and growth priorities.
According to McKinsey & Company, data-driven organizations outperform competitors in customer acquisition and retention. Meanwhile, dashboards help unify teams around shared KPIs.
Key Benefits
Real-time visibility into performance
Faster decision-making across teams
Better forecasting accuracy
Improved campaign optimization
However, dashboards deliver results only when aligned with clear business goals.
How Ecommerce Dashboards Work
Understanding how dashboards function helps businesses implement them effectively and maximize value across workflows.
Data Integration
Modern dashboard for ecommerce connects multiple data sources including sales platforms, marketing tools, and inventory systems.
Processing and Visualization
Meanwhile, dashboards convert raw data into charts and insights, making trends easier to understand.
Decision-Making Support
However, the true value lies in actionable insights that guide pricing, promotions, and operational strategies.
What Should an Ecommerce Dashboard Contain?
An effective ecommerce metrics dashboard balances strategic and operational insights.
Revenue and Sales Performance
Track total revenue, gross & net profit, product performance, and channel contribution.
Customer Behavior Insights
Monitor traffic sources, repeat purchases, and conversion funnels.
Marketing Effectiveness
Measure CAC, ROAS, and campaign ROI.
Operational Efficiency
Analyze fulfillment times, returns, and inventory turnover.
Although many tools provide individual reports, a unified dashboard for ecommerce site simplifies decision-making.
Real Examples of Ecommerce Dashboards in Action
A mid-sized fashion retailer implemented an integrated ecommerce dashboards & reporting solution combining Shopify analytics, GA4 insights, and advertising data into one unified platform. As a result, the company improved campaign targeting, increased conversion rates significantly, and streamlined reporting processes across marketing and leadership teams.
Similarly, a growing D2C electronics brand adopted predictive analytics dashboards to optimize inventory planning and customer acquisition strategies. Meanwhile, the company reduced stockouts, improved demand forecasting accuracy, and increased overall profitability by focusing on fewer high-impact KPIs aligned with business objectives.
What Are the Advantages of Using an Ecommerce Dashboard?
Great ecommerce dashboards take massive amounts of data and boil it down into useful insights that drive decision making, improving the speed, clarity, and alignment of teams. It allows firms to track performance in real time, align strategy across divisions, and respond proactively to consumer and market changes efficiently.
Advantages
Real-Time Decision-Making
A dashboard for ecommerce enables teams to respond instantly to performance changes by providing immediate visibility into revenue fluctuations, campaign effectiveness, and operational bottlenecks. This supports faster responses to seasonal demand changes and evolving customer behavior patterns across markets.
Centralized Data Visibility
Meanwhile, teams analyze multiple metrics from one interface instead of navigating disconnected tools and reports. A unified dashboard for ecommerce site ensures consistent data interpretation, improves collaboration, and reduces time spent reconciling conflicting performance insights across departments.
Better Strategic Planning
However, dashboards also support forecasting and long-term planning by helping organizations identify recurring trends, evaluate historical performance, and make informed decisions aligned with long-term growth strategies and evolving customer expectations across different business segments.
Operational Efficiency
Tracking logistics through an admin dashboard for ecommerce website reduces delays by highlighting inefficiencies in fulfillment, shipping workflows, and inventory movement. Meanwhile, operations teams can proactively resolve bottlenecks and maintain service quality across customer touchpoints.
Team Alignment
Although departments operate differently, shared dashboards align teams around common KPIs and objectives. This improves accountability, strengthens collaboration, and ensures consistent decision-making across marketing, operations, finance, and executive leadership functions.
What Are the Limitations of Ecommerce Dashboards?
Although powerful, ecommerce dashboards have limitations businesses must recognize before implementation, particularly when expectations exceed available data infrastructure, technical expertise, or organizational readiness for consistent data-driven decision-making practices.
Limitations
Data Dependency
Insights rely heavily on accurate integrations and clean datasets across platforms. If systems are misaligned or incomplete, dashboards may produce misleading insights that negatively influence strategic planning and operational performance decisions across teams.
Over-Reliance on Metrics
However, numerical insights cannot fully capture qualitative factors such as customer sentiment, competitive positioning, and brand perception. Businesses must interpret dashboards within broader market contexts rather than relying solely on automated reporting outputs.
Setup Complexity
Meanwhile, integrating multiple tools into a single analytics environment requires planning, technical resources, and continuous maintenance to ensure reliability, consistency, and scalability across changing business requirements.
Cost Concerns
Advanced dashboards offering predictive analytics, automation, and customization often require significant financial investment, making adoption more challenging for smaller ecommerce businesses with limited budgets and technical resources.
Training Requirements
Although dashboards simplify reporting workflows, teams still require onboarding and ongoing training to interpret ecommerce dashboard metrics for store health accurately and use insights effectively across decision-making processes.
What Challenges Do Businesses Face When Building Ecommerce Dashboards?
Building a scalable ecommerce dashboard involves operational and strategic challenges that many businesses underestimate, especially when managing multiple stakeholders, evolving technologies, and increasingly complex data ecosystems across departments and global markets.
Challenges
Metric Overload
Many dashboards fail because they track excessive KPIs instead of focusing on meaningful indicators like revenue growth, CAC, CLV, and conversion performance that directly influence strategic decisions and measurable business outcomes.
Integration Complexity
Combining multiple tools into one ecommerce dashboards & reporting system often creates inconsistencies, delays, and governance challenges that impact reporting accuracy and organizational trust in analytics outputs.
Real-Time Accuracy Issues
Meanwhile, syncing delays across systems may lead to mismatched insights, reducing confidence among decision-makers and slowing organizational responsiveness to emerging performance trends and opportunities.
Customization vs Simplicity
However, overly customized dashboards can become difficult to navigate and maintain, reducing adoption rates and limiting their effectiveness across different business functions and experience levels.
Scaling with Growth
As businesses expand into new markets, channels, and product categories, dashboards must evolve continuously to support increasing complexity and larger data volumes without sacrificing usability or performance.
According to Gartner, integration and data governance remain key analytics challenges for organizations adopting advanced reporting systems. Many businesses struggle to unify data sources, maintain accuracy, and ensure compliance at scale. Strong governance frameworks and modern integration strategies are essential for reliable insights.
Best Practices for Building KPI Dashboards in Ecommerce
Following proven best practices for building KPI dashboard ecommerce ensures dashboards remain scalable, actionable, and aligned with business goals while delivering consistent insights across teams. Businesses should focus on measurable KPIs, role-based views, automation, and real-time tracking using tools like Google Analytics, Shopify Analytics, Looker Studio, Power BI, Tableau, and Supaboard to unify data across platforms efficiently.
Meanwhile, organizations should prioritize usability by designing dashboards based on user roles such as executives, marketers, and operations teams. However, maintaining consistent definitions, automated reporting workflows, and clean integrations ensures long-term reliability, scalability, and improved decision-making across departments and evolving business needs.
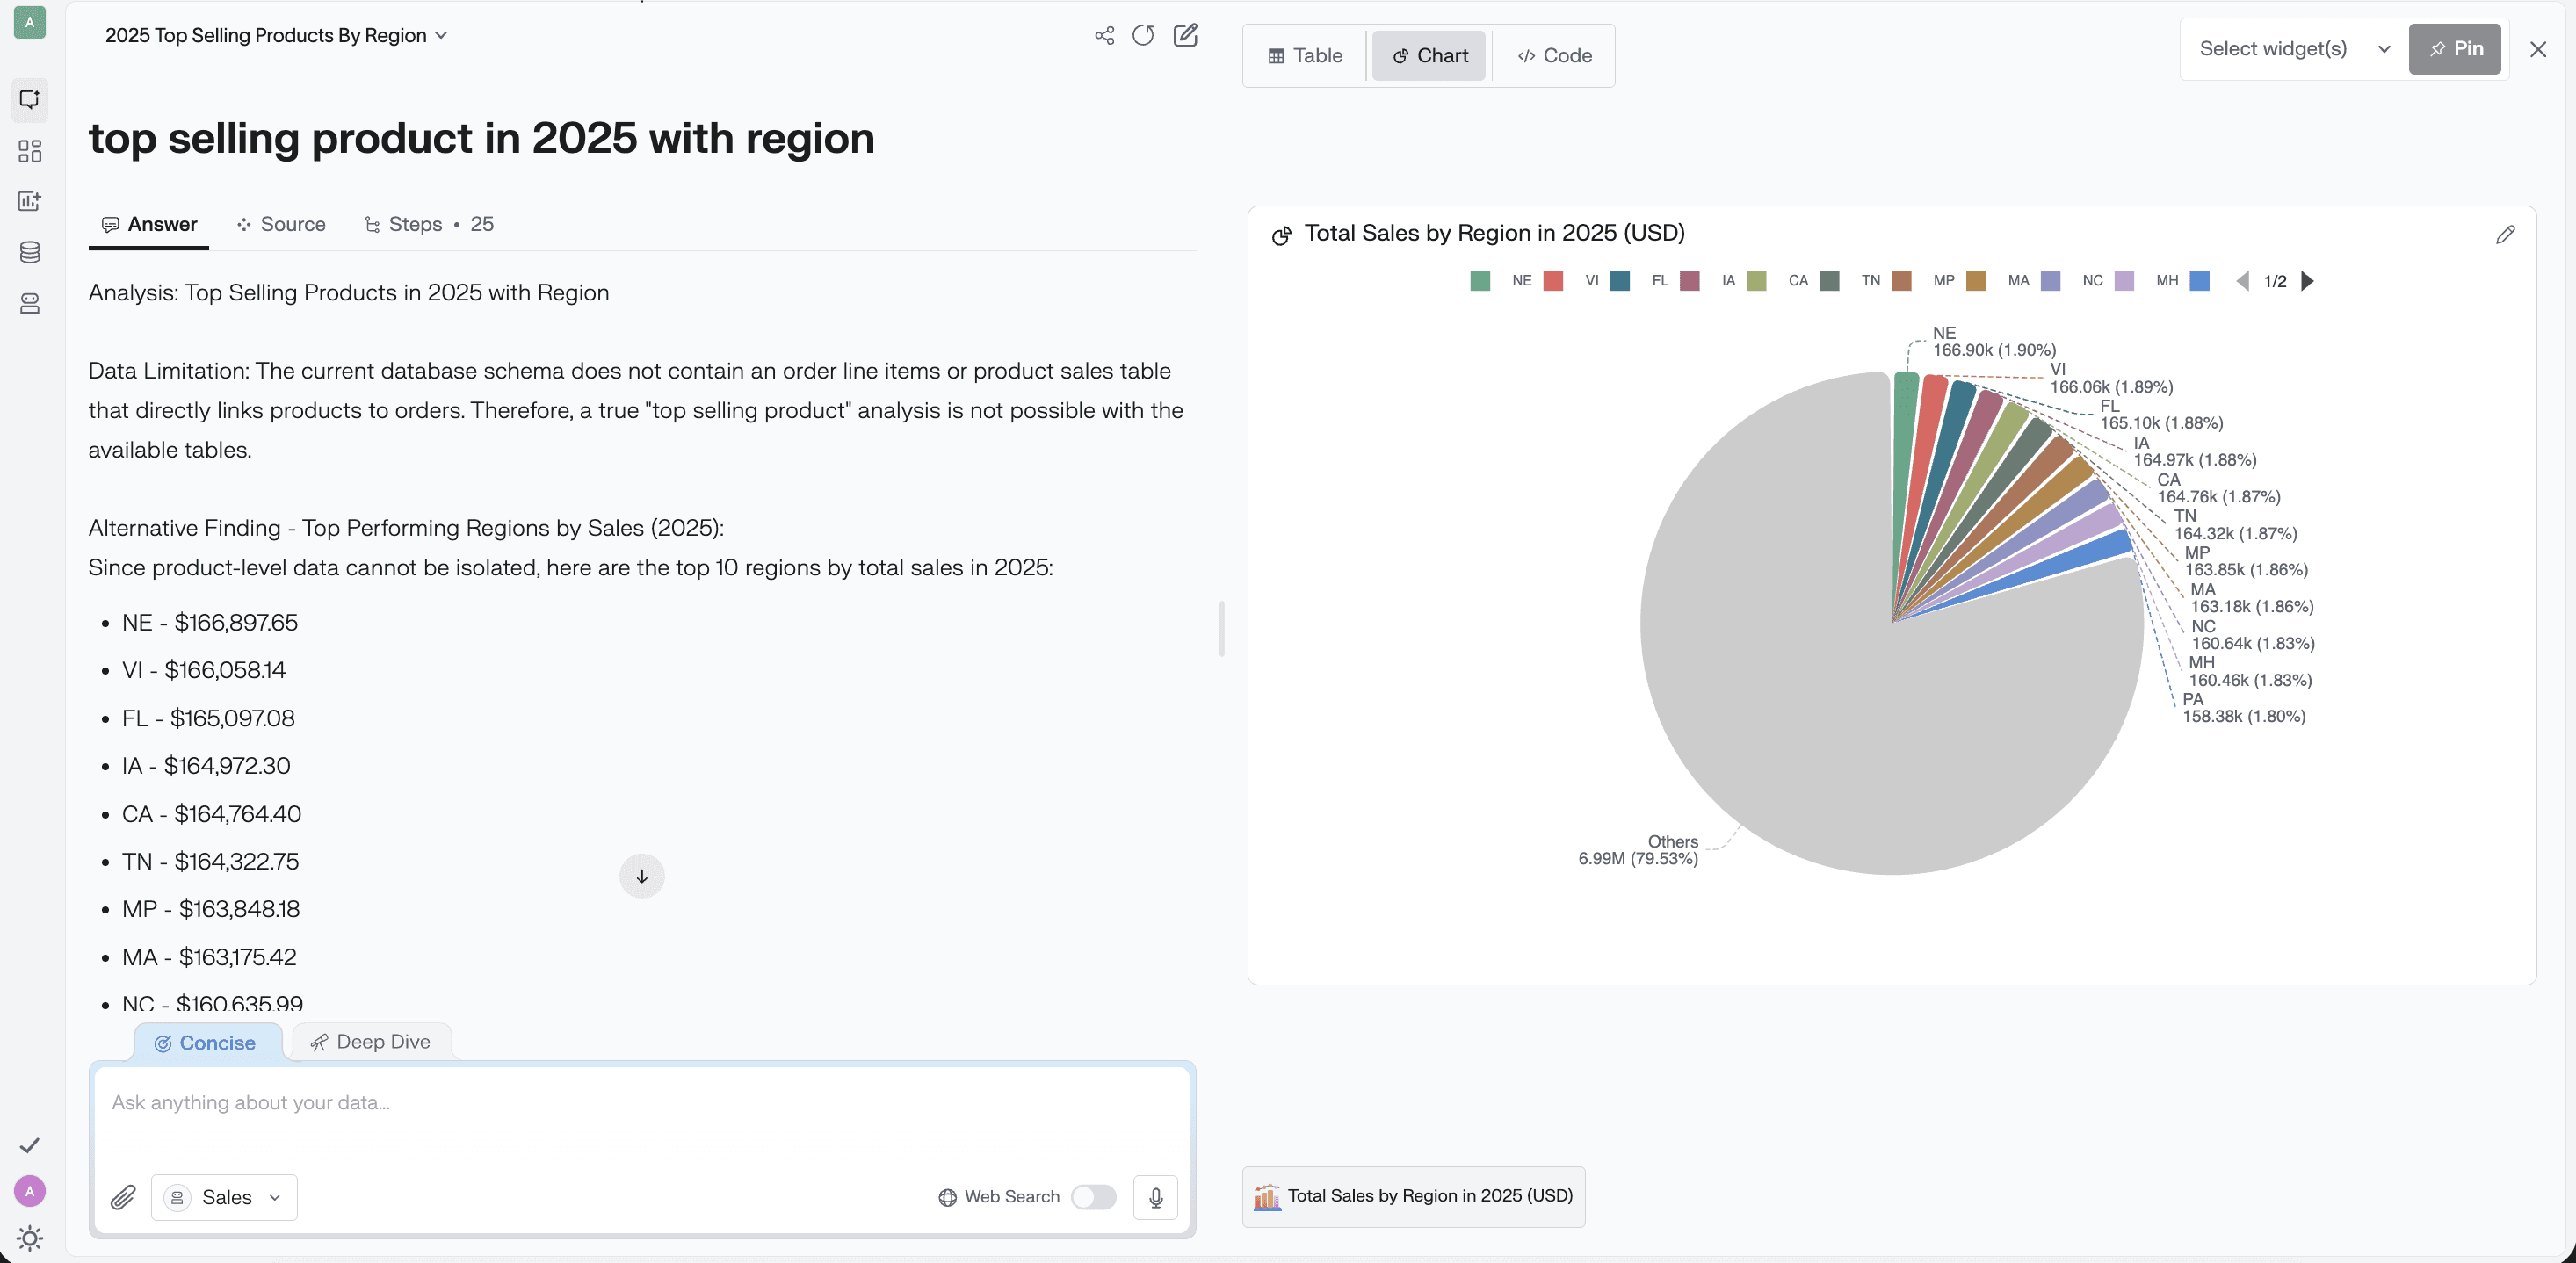
In the above image, as you can see, the pie chart clearly shows regional sales distribution along with actionable insights, helping teams quickly identify top-performing regions, compare performance, and spot growth opportunities. This type of visualization improves reporting clarity, speeds up analysis, and supports smarter decision-making. Dashboard source: Supaboard.
FAQs
What is an ecommerce dashboard and why is it important for online store growth?
An ecommerce dashboard is a centralized analytics hub that combines sales, marketing, and operational data into one interface. Research shows dashboards help businesses track KPIs, improve efficiency, and increase profitability by enabling faster data-driven decisions across teams.
What metrics should an ecommerce dashboard track for better performance insights?
A strong ecommerce dashboard should track revenue, conversion rate, AOV, CAC, CLV, cart abandonment, and campaign performance. These metrics help businesses evaluate marketing effectiveness, monitor growth trends, and optimize strategies using actionable, data-driven insights.
How do ecommerce dashboards improve decision-making and operational efficiency?
Ecommerce dashboards provide real-time visibility into performance, allowing teams to identify trends, resolve bottlenecks, and optimize campaigns quickly. Studies show unified analytics improves planning, customer experience, and operational efficiency across growing ecommerce businesses.
Which tools are best for building ecommerce dashboards for growing businesses?
Popular ecommerce dashboard tools include Google Analytics, Shopify Analytics, Tableau, Power BI, and Looker Studio. These platforms integrate multiple data sources, automate reporting workflows, and support scalable analytics strategies for growing ecommerce teams.
How can small ecommerce businesses use dashboards to scale faster?
Small ecommerce businesses can use dashboards to monitor traffic sources, track conversions, optimize marketing spend, and forecast demand. Research shows analytics-driven strategies improve targeting, increase ROI, and support sustainable growth across customer lifecycle stages.
Conclusion
When you want to scale operations, increase visibility across teams and keep everyone united around measurable goals, an efficient ecommerce dashboard is a need. It pulls together your most critical business data in one place, allowing teams monitor performance, identify trends early, and make faster choices with certainty.
A good ecommerce dashboard is not only about reporting data. Real-time insights into sales success, customer behavior, inventory movement, marketing ROI, and operational efficiency. Teams may collaborate on one source of truth instead of toggling between spreadsheets and numerous technologies, keeping their eyes on what grows revenue.
With the proper tools, an emphasis on measuring the most relevant KPIs and an iterative approach to your ecommerce dashboard strategy, businesses can increase forecast accuracy, identify new income opportunities and adapt faster to changing customer demand. Whether you’re establishing a DTC brand or running a big multi-channel ecommerce business, the appropriate dashboard makes data actionable.
Ultimately, a powerful ecommerce dashboard is not simply a reporting layer, it’s a decision-making system that allows your business to scale smarter, run more efficiently, and flourish with clarity.
Get a free 14-day trial of the best ecommerce dashboard—try now.


