Top 10 BI Tools in 2026 (with Pricing, AI Features & Enterprise Fit)
Discover the top 10 business intelligence (BI) tools in 2026. Compare features, pricing, and use cases to choose the best BI software for your business.

Introduction
Businesses are generating more data than ever, and teams are increasingly relying on business intelligence platforms to turn raw information into meaningful insights. As organizations scale and decision-making becomes more data-driven, this shift creates new opportunities to improve efficiency, uncover growth trends, and make smarter strategic decisions.
As business intelligence continues to evolve, companies now have access to tools that do far more than basic reporting. In 2026, modern BI platforms offer real-time dashboards, AI-powered analytics, self-service reporting, and advanced data visualization capabilities that help teams act faster and with greater confidence.
This guide is for businesses looking to identify Top BI Tools in 2026 and understand which platform is best suited to their reporting, analytics, and growth needs.
What Are Business Intelligence Tools?
Business intelligence (BI) tools are powerful software that collect raw data from databases, apps, and spreadsheets, then transform it into easy-to-understand dashboards, charts, and reports.
They help businesses track important KPIs, discover hidden trends, and turn complex data into clear, actionable insights, enabling faster and smarter decision-making in real time.
Why Business Needs BI Tools in 2026
In 2026, businesses rely on Business Intelligence (BI) tools to turn large volumes of data into real-time, actionable insights. As data grows across multiple systems, BI tools help organizations unify information, track KPIs, and make faster, data-driven decisions without relying on manual reporting.
Modern BI platforms also provide a competitive advantage by using AI to detect patterns, forecast trends, and deliver insights instantly. Instead of static dashboards, users can get answers quickly, improving agility and decision-making across teams.
Additionally, BI tools improve efficiency and accessibility. They reduce reporting costs, minimize errors, and enable self-service analytics, allowing non-technical users to explore data independently. This helps organizations move faster, stay aligned, and operate more effectively in a data-driven environment.
Key Benefits of BI Tools in 2026
Faster answers, not just dashboards: Modern BI tools allow users to ask questions in natural language and get instant insights, eliminating the need to navigate complex reports or wait for manual analysis.
AI-driven insights at scale: Advanced BI platforms use AI and machine learning to automatically detect patterns, anomalies, and trends across large datasets, helping teams uncover insights that might otherwise be missed.
From static reports to decision systems: BI tools have evolved from passive reporting tools into active decision systems, delivering real-time insights directly within business workflows to enable faster, more informed actions.
Reduced dependency on data teams: With self-service analytics and AI-powered interfaces, business users can access and explore data independently, reducing bottlenecks and freeing up analysts for higher-value work.Factors to Consider When Choosing a BI Tool
Factors to Consider When Choosing a BI Tool
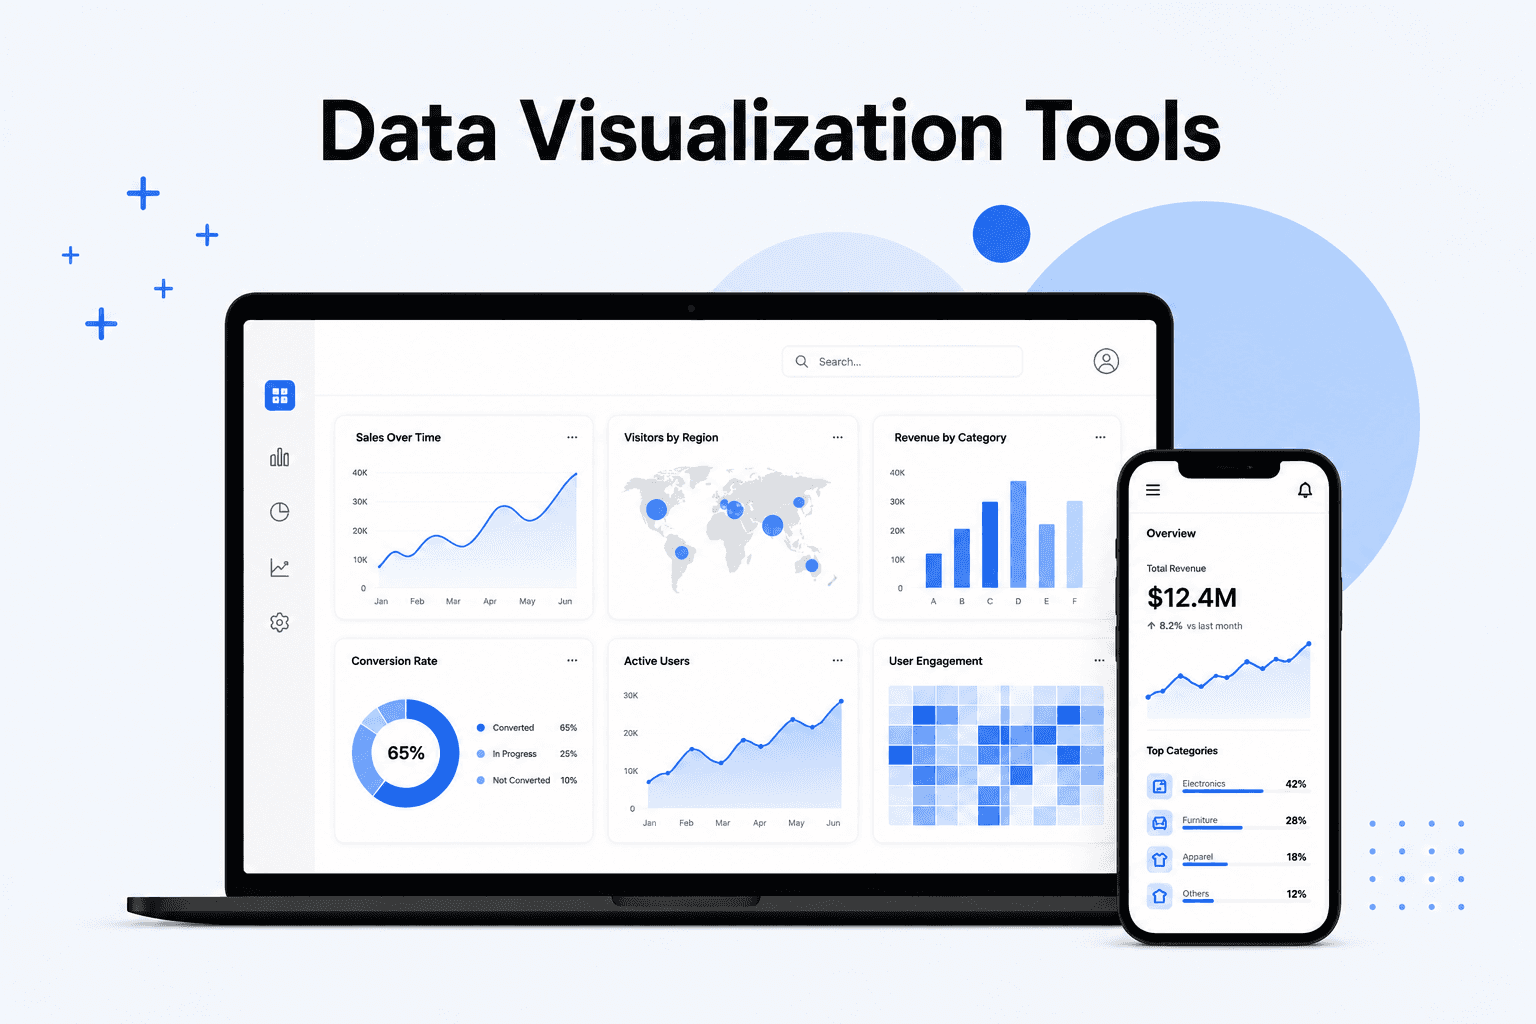
1. Visual Functionality & Presentation: A BI tool should offer clear, interactive, and customizable dashboards that make data easy to understand. Strong visualization capabilities help users quickly interpret trends, compare metrics, and communicate insights effectively across teams and stakeholders.
2. Pricing: Evaluate the total cost of ownership, including licensing, user-based pricing, add-ons, and scaling costs. Many BI tools appear affordable initially but become expensive as data volume, users, and advanced features increase over time.
3. Data Integration & Connectivity: BI tools must connect seamlessly with your existing data sources such as CRMs, databases, cloud apps, and spreadsheets. Choosing a tool with strong native connectors reduces setup complexity and ensures smoother, more reliable data workflows.
4. Data Preparation & Transformation: Most business data requires cleaning and transformation before analysis. A good BI tool should provide built-in data preparation features, allowing users to filter, combine, and structure data without heavy reliance on external tools or coding.
5. Data Modeling Capabilities: If your data exists across multiple sources, the tool should support data modeling to create relationships between datasets. This enables unified analysis without manual merging, improving accuracy and simplifying complex reporting processes.
6. Ease of Use & Learning Curve: From real user feedback, usability is a top priority. A BI tool should offer an intuitive interface, minimal learning curve, and fast onboarding, allowing both technical and non-technical users to build reports and extract insights efficiently.
7. Sharing, Collaboration & Accessibility: Users often prioritize how easily insights can be shared. The tool should support secure sharing, cloud access, mobile compatibility, and collaboration features, ensuring stakeholders can access dashboards anytime without friction or technical barriers.
8. AI & Natural Language Capabilities: Modern BI tools should include AI-powered features like automated insights and natural language queries. These capabilities allow users to ask questions directly and receive answers, making data more accessible and reducing dependency on analysts.
How Business Intelligence Tools Work?
Business intelligence tools follow a simple but powerful process to turn raw data into useful insights. They collect data from different sources, clean and organize it, analyze it, and finally present it in easy-to-understand dashboards and reports.
Here’s how it typically works:
Data Collection: The tool connects to your CRM, databases, spreadsheets, and other apps to gather both structured and unstructured data.
Data Transformation: It cleans the data, removes errors, and organizes it so everything is consistent and accurate.
Analysis & Insights: Using AI and smart algorithms, the tool finds patterns, trends, and anomalies, often surfacing insights automatically.
Visualization: The results are displayed as interactive charts, graphs, and dashboards that anyone can explore and understand.
Actionable Delivery: Users get real-time alerts, natural language answers, and reports that help them make faster, better decisions.
Example:
Companies like Amazon use BI tools to process massive data at scale. According to McKinsey & Company, organizations that leverage customer analytics extensively are 23 times more likely to acquire customers and 6 times more likely to retain them. Amazon applies this approach by analyzing user behavior, purchase patterns, and demand signals in real time. This enables personalized recommendations, dynamic pricing, and optimized inventory, driving higher conversions, stronger customer loyalty, and more efficient operations.
Top 10 Business Intelligence (BI) Tools in 2026
Below are the best BI tools in 2026, chosen for their innovation, usability, and business impact.
Microsoft Power BI: Good for traditional dashboard
Microsoft Power BI is a leading business intelligence tool that helps organizations turn raw data into interactive dashboards and real-time insights. This business intelligence tool integrates seamlessly with Microsoft products like Excel, making data analysis and reporting more efficient.
As a modern business intelligence tool, it also offers AI-powered analytics and natural language queries. However, this business intelligence tool can become complex when handling large datasets or advanced calculations.
Power BI Key Features:
Microsoft Ecosystem Integration: Works seamlessly with Excel, Teams, and Azure for unified workflows.
AI & Copilot Insights: Converts natural language queries into visual, data-rich reports.
Real-Time Dashboards: Connects to live data sources across cloud and on-prem systems.
Enterprise Security: Provides encryption, role-based access, and compliance certifications.
Extensive Connectors: Integrates hundreds of third-party apps and custom data connectors.
Deployment Options:
Available on cloud, on-premises and hybrid environments, with embedded analytics for apps and portals.
Power is Best For:
If you have a strong technical team, Power BI is an excellent choice, as it offers deep customization, advanced modeling, and powerful integrations.
Real-World Use Case:
A global manufacturer connected IoT sensor and ERP data in Power BI to monitor machine health. AI-driven alerts enabled: predictive maintenance, cutting downtime by 20% and boosting factory efficiency worldwide.
Pricing
Power BI Pro starts at $14/user/month (billed annually). Premium Per User (PPU) is $24/user/month. Free tier available for individuals. Capacity-based Fabric plans start from lower entry points for high-volume use. While affordable for Microsoft-heavy teams, costs scale with users and advanced features.
Supaboard: Best for AI-powered business intelligence

Supaboard is an AI-powered data analytics platform built for fast, insight-driven decision-making. It allows users to ask questions in plain language and instantly generate visual reports using its “Ask AI” feature.
This modern analytics solution offers real-time dashboards and collaboration tools, making it easy for teams to turn complex data into clear, actionable insights without technical expertise.
Supaboard Key Features:
AI Query Assistant: Ask questions in natural language.
Drag-and-Drop Dashboards: Build visuals without coding.
Team Collaboration: Share insights securely with colleagues.
Cloud Access: Work from anywhere with real-time data.
Deployment:
Cloud-based with secure, real-time access across devices, plus embedded analytics and white-label support for flexible deployment.
Supaboard is Best For:
Enterprises, SaaS companies, startups, and data-driven teams seeking simple, AI-powered BI, especially if you need faster insights, time savings, and a cost-effective
Real-World Use Case: Jindal Healthcare, a mid sized US-based RCM company, leveraged Supaboard to integrate claims, billing, A/R, and denial datasets in one platform. Supaboard’s real-time dashboards and automatic report updates replaced their manual spreadsheets. When revenue leakages or bottlenecks were detected, scheduled alerts empowered management to react instantly. This automation cut daily task times from 4 hours to just 2–3 minutes, reduced analysis costs to a tenth, and improved overall operational efficiency, enabling proactive, insight-driven revenue cycle management.
Pricing
Supaboard starts at $85–$99/month for the basic plan. Business plan is $199–$249/month for multiple agents and collaboration features. Affordable entry for AI-focused teams, with scaling based on usage and users. Know here full pricing details.
Tableau
Overview:
Tableau, owned by Salesforce, is a leading data visualization and analytics platform that helps users transform complex data into interactive dashboards and visual stories.
Known for its intuitive drag-and-drop interface and strong visual capabilities, Tableau also includes AI-driven insights and seamless integration with Salesforce, making it popular for deep data exploration and business reporting.
Tableau Key Features:
Ask Data: Type natural language questions to get instant visuals.
Dynamic Visualizations: Offers hundreds of chart, graph, and map templates.
Salesforce Integration: Syncs directly with CRM and cloud data for unified insights.
Data Blending: Combine multiple data sources in one dashboard.
AI Insights (Tableau Pulse): Detects patterns and trends automatically.
Deployment Options:
Available on Tableau Cloud, Tableau Server (on-premise or hybrid), and Tableau Public for free, open sharing.
Tableau is Best For:
Organizations and analysts focused on data storytelling, business dashboards, and predictive insights, especially those using Salesforce platforms.
Real-World Use Case:
A retail company used Tableau to visualize sales and inventory data across regions. By spotting seasonal trends and adjusting stock levels, they boosted quarterly revenue by 12% and improved supply efficiency.
Pricing
Tableau Cloud Standard: Viewer $15/user/month, Explorer $42/user/month, Creator $75/user/month (billed annually). Enterprise edition: Viewer $35/user/month, Explorer $70/user/month, Creator $115/user/month. Strong visual tool but per-user costs add up quickly for large teams.
Looker

Overview:
Looker, part of Google Cloud, is a modern data analytics platform built for teams that need reliable, real-time data access. Instead of just creating dashboards, Looker focuses on building a consistent data layer, so everyone in the business works from the same metrics.
It’s especially useful for companies that want to embed analytics into apps or workflows, not just view reports. While powerful and flexible, it usually requires some data modeling knowledge, making it better suited for teams with strong data foundations.
Key Features:
LookML Modeling: Define centralized business logic for consistent, reusable metrics.
Embedded Analytics: Integrate dashboards and insights directly into apps or portals.
BigQuery Integration: Optimized for large-scale, high-performance data analysis.
Governed Data Layer: Ensures accuracy and trusted reporting across teams.
Custom Reports: Build flexible, interactive data views with granular access control.
Deployment Options:
Available only on Google Cloud as a fully managed, cloud-based analytics service.
Best For:
Large enterprises and SaaS providers needing embedded analytics, data governance, and scalable cloud performance.
Real-World Use Case:
A logistics firm used Looker to merge GPS and weather data into real-time dashboards. Predictive insights optimized delivery routes, cutting fuel costs by 14% and improving on-time performance.
Pricing
Looker uses quote-based pricing. Standard edition starts around $60,000–$66,000/year (platform fee + included users). Mid-sized deployments (50 users) typically range $84K–$120K/year. Enterprise costs are higher. Best suited for organizations that can justify the investment.
Metabase
Overview:
Metabase is an open-source analytics platform built to make data exploration simple and accessible. It provides an easy-to-use interface with a no-code query builder, allowing teams to create dashboards and reports without technical expertise.
Metabase is especially popular among startups and small teams because it’s quick to set up and cost-effective. While it covers essential analytics needs well, it may feel limited for more advanced, enterprise-level use cases.
Metabase Key Features:
Open-Source Flexibility: Fully customizable and free to self-host.
Simple Query Interface: Create visual reports without writing SQL.
Scheduled Reports: Automate regular email or Slack updates.
Data Alerts: Get notified instantly about metric changes.
Community Support: Backed by an active global developer network.
Deployment Options:
Available as self-hosted for full control or Metabase Cloud for managed, automatic updates.
Metabase is Best For:
Startups, nonprofits, and small teams seeking affordable, user-friendly analytics with flexible hosting and open-source freedom.
Real-World Use Case:
A nonprofit used Metabase to monitor donations and event success. Visual dashboards revealed top-performing campaigns, helping boost donations by 25% year-over-year through smarter fund allocation.
Pricing
Open Source: Free (self-hosted). Cloud Starter: $100/month (+$6/user). Pro: $575/month (+$12/user). Enterprise: Custom, starting ~$20K/year. Extremely budget-friendly for smaller teams. Know here full Metabase pricing details.
Domo
Domo is a fully cloud-based business intelligence (BI) platform designed for enterprise-scale data integration and real-time analytics. It unifies data, AI insights, and collaboration tools in one platform to help organizations make faster, smarter decisions.
Domo Key Features:
1,000+ Data Connectors: Integrates seamlessly with cloud, on-premise, and API data sources.
Real-Time Collaboration: Teams share dashboards and updates instantly.
Predictive Analytics: AI-driven forecasting and pattern recognition.
Mobile Dashboards: Access analytics from anywhere with full functionality.
Data Governance: Centralized controls ensure compliance and data accuracy.
Deployment Options:
Offered as a fully managed cloud platform, ensuring scalability, security, and automatic updates.
Domo is Best For:
Enterprises managing large, cross-departmental data systems that require automation, integration, and real-time analytics.
Real-World Use Case:
A major telecom company used Domo to integrate marketing, finance, and operations data into one centralized dashboard. Automated data pipelines and AI alerts replaced manual reports, reducing reporting time by 60% and improving customer response rates by 35%. This shift enabled leaders to track KPIs live, aligning departments and driving quicker, data-backed decisions.
Pricing
Credit-based model with no public per-user rates. Small deployments start around $30K–$50K/year. Mid-market typically $80K–$250K/year. Enterprise often exceeds $250K+. Usage-based costs can rise with heavy data volume. here full pricing details.
Apache Superset
Apache Superset is a powerful open-source business intelligence platform designed for technical teams and data professionals. It supports advanced SQL-based analytics, interactive dashboards, and rich data visualizations. With strong scalability and performance, it is well-suited for handling large, high-volume datasets efficiently.
Apache Superset Key Features:
SQL Editor (SQL Lab): Write and visualize SQL queries in real time.
Custom Dashboards: Build interactive dashboards with 40+ chart types.
Scalable Architecture: Optimized for big data and high-performance queries.
Integration Ready: Connects easily with major databases and cloud data engines.
Data Security: Role-based access with OAuth, LDAP, and SSO options.
Deployment Options:
Can be self-hosted on servers, Docker, or Kubernetes, or deployed via managed cloud hosting for easier setup.
Superset is Best For:
Data engineers, analysts, and enterprises that need customizable, SQL-driven analytics with open-source flexibility and scalability.
Real-World Use Case:
A fintech startup uses Apache Superset to monitor millions of daily transactions. Custom SQL dashboards visualize fraud patterns and transaction anomalies in real time, alerting analysts instantly. This proactive insight enabled faster fraud detection, saving thousands in potential losses quarterly and improving transaction security by 40% within six months.
Pricing
Fully open-source: Free (self-hosted). Managed options like Preset: Free tier (up to 5 users), Professional from $20/user/month (billed annually). Low total cost of ownership, mainly infrastructure. Know here full superset pricing details.
Redash
Redash is a lightweight, open-source business intelligence tool designed for easy data exploration using SQL queries and interactive dashboards. It helps teams visualize, share, and collaborate on insights quickly. With flexible integrations and a user-friendly interface, Redash is popular among startups and data teams.
Redash Key Features:
SQL Query Editor: Write, run, and visualize SQL queries with ease.
Data Sharing: Securely share dashboards or embed them in other tools.
APIs & Integrations: Automate workflows and connect to 40+ data sources.
Custom Alerts: Get instant notifications for metric changes via Slack or email.
Visualization Templates: Create charts, tables, maps, and pivot views effortlessly.
Deployment Options:
Supports cloud hosting and on-premise deployments for full data control.
Redash is Best For:
Developers, analysts, and SMBs needing fast, SQL-driven analytics without complex setup or heavy licensing costs.
Real-World Use Case:
A digital marketing agency uses Redash to unify data from Google Ads, Facebook, and LinkedIn. Real-time dashboards track ad spend, impressions, and ROI, helping teams reallocate budgets instantly boosting campaign performance by 10% and cutting reporting time in half.
Qlik Sense
Qlik Sense is a modern business intelligence platform powered by its associative analytics engine. It enables users to explore complex datasets, uncover hidden relationships, and gain deeper insights. With built-in AI capabilities, it supports smarter, faster decision-making and scalable analytics across large enterprises and data-driven organizations.
Qlik Sense Key Features:
Associative Data Engine: Explore all connected data without query limitations.
AI-Augmented Analytics: Provides auto-generated insights and smart search.
Scalable Architecture: Handles enterprise-level data workloads seamlessly.
Drag-and-Drop Dashboards: Build visualizations intuitively, no coding required.
Hybrid Cloud Support: Deploy across cloud, hybrid, or on-prem environments.
Deployment Options:
Supports cloud, on-premise, and hybrid environments for flexible data governance and scalability.
Qlik is Best For:
Enterprises and industries like healthcare, finance, and manufacturing needing advanced, AI-assisted analytics and strong data integration.
Real-World Use Case:
A healthcare provider integrated patient, staffing, and billing data using Qlik Sense. Real-time dashboards identified readmission trends and resource gaps, improving care coordination and reducing operational costs by 12% within a few months. The system also enhanced transparency across departments, enabling data-driven decision-making hospital-wide.
Pricing
Qlik Cloud: Starter $300/month (10 users), Standard $825/month, Premium $2,750/month. User-based options add flexibility. Enterprise is custom. Mid-to-high cost for advanced associative analytics. Know here full pricing details.
Basedash
Basedash is a modern business intelligence tool that connects directly to live databases, enabling teams to create real-time dashboards quickly and easily. It focuses on speed, simplicity, and minimal setup, helping businesses analyze data, track performance, and make informed decisions without complex integrations or technical overhead.
Basedash Key Features:
Live Data Connection: Fetches real-time data straight from your databases.
Simple SQL Interface: Enables direct querying of your data with minimal overhead.
Role-Based Access: Provides secure permissions for team members.
Minimal Setup: Get going in minutes with minimal infrastructure.
Clean UI: Presents an intuitive and easily customizable interface.
Deployment Options:
Cloud-based service with optional self-hosting only in the Enterprise tier.
Basedash is Best For:
Startups and small tech teams needing fast, lightweight BI that connects directly to operational databases and delivers insights quickly.
Real-World Use Case:
A startup connected its PostgreSQL database to Basedash to monitor product-usage trends live. This helped identify under-used features and prioritize updates, boosting customer retention by 22% within the first year.
Pricing
Starts at $250/month for the Basic plan, scaling up to $1,000/month for Growth plans. Budget-friendly for lean teams with flat monthly pricing and no per-user fees in core tiers. Know here full basedash pricing details.
Why These Are the Most Trusted BI Platforms, Best Real-Time Analytics Platforms in 2026, and Top Business Intelligence Tools
As organizations evaluate the most trusted BI platform for large-scale data exploration, they increasingly look for solutions that also rank among the best real-time analytics platforms in 2026. Modern buyers compare platforms based on scalability, real-time performance, AI-powered insights, and ease of adoption.
This guide highlights the best business intelligence tools in 2026 by comparing leading platforms used by enterprises, SaaS companies, and data-driven teams, making it easier to identify the top 10 business intelligence tools for long-term growth and faster decision-making
What to Consider When Choosing a BI Tool ?
Here's a clean, simple, and impactful version with only 4 main important points:
Factors to Consider When Choosing a Business Intelligence Tool
Selecting the right BI tool can make a big difference to your team’s success. Here are the 4 most important factors to consider:
Ease of Use: The tool should be simple enough for non-technical users while still powerful for analysts. If it’s too complicated, adoption will suffer.
Data Integration: It must connect smoothly with your existing systems like CRMs, databases, cloud apps, and spreadsheets. Good integration saves time and prevents data silos.
AI & Analytics Capabilities: Look for practical AI features like natural language querying and automated insights — not just flashy demos. The best tools turn data into clear, actionable answers.
Pricing & Value: Consider total cost, including licensing, scalability, and hidden fees. Choose a tool that offers strong ROI without becoming expensive as you grow.
BI Tools: Deployment Options Explained
When choosing a business intelligence tool, one of the most important decisions is how it will be deployed. This affects how your team accesses data, how secure it is, and how much effort is needed to maintain the system.
1. Cloud-Based BI Tools
Cloud-based BI tools run online, so you don’t need to install or manage anything locally. They are quick to set up, easy to access from anywhere, and work well for teams that need flexibility or remote collaboration. Most startups and growing teams prefer this option because it saves time and reduces technical overhead.
2. On-Premise BI Tools
On-premise BI tools are hosted on your own servers, which gives you full control over your data. This setup is often used by companies that deal with sensitive information or strict regulations. However, it usually requires a dedicated IT team to manage updates, security, and performance.
3. Hybrid BI Tools
Hybrid BI tools combine both approaches. You can keep critical data on your own systems while still using cloud features for reporting and analysis. This setup works well for businesses that need flexibility but can’t fully move everything to the cloud.
What are the best BI tools for startups in 2026?
The best BI tools for startups are affordable, easy to use, and scalable as the company grows. Some of the top options include:
Supaboard: AI-powered BI tool built for fast insights and startup teams
Microsoft Power BI: ideal for startups using Microsoft products
Google Looker Studio: best free BI dashboard tool
Metabase: popular open-source BI platform
Zoho Analytics: affordable analytics solution for small teams
Tableau: powerful visualization for growing startups
These tools help startups track metrics, visualize performance, and make data-driven decisions without building complex data infrastructure.
FAQ: Business Intelligence (BI) Tools
1. What are business intelligence tools?
Business intelligence tools are software platforms that collect, process, and analyze data to generate actionable insights. These tools transform raw data into dashboards and reports, helping organizations track performance, identify trends, and make faster, data-driven decisions.
2. How do business intelligence tools work?
Business intelligence tools work by collecting data from multiple sources, transforming it using ETL processes, and analyzing it to detect patterns. They present insights through dashboards and reports, enabling users to understand performance and make informed decisions in real time.
3. Why are business intelligence tools important for businesses?
Business intelligence tools are important because they help organizations turn data into insights. They improve decision-making, increase operational efficiency, identify opportunities, and provide real-time visibility into performance, allowing businesses to stay competitive in a data-driven environment.
4. What features should you look for in business intelligence tools?
Key features of business intelligence tools include data integration, real-time dashboards, data visualization, scalability, and AI-powered analytics. These features help users analyze data efficiently, generate insights quickly, and support better decision-making across departments.
5. Can non-technical users use business intelligence tools?
Yes, modern business intelligence tools are designed for non-technical users. They offer drag-and-drop dashboards, self-service analytics, and natural language queries, making it easy for teams to explore data and generate insights without coding or advanced technical skills
What is the best way to compare enterprise software products?
The best way is to align tools with your business goals, compare core features, integrations, security, scalability, and pricing, and validate through demos or trials. A structured comparison matrix helps remove bias and ensures the selected software fits long-term enterprise needs.
7. How to choose the right BI tool for your business?
Assess team size, data sources, budget, and technical skills. Start with free trials to find the most intuitive and scalable BI platform.
8. What are the fastest cloud BI tools for enterprise reporting and self‑service analytics in 2026?
The fastest cloud BI tools in 2026 include Supaboard, Looker, Power BI, Domo, and Sigma. These platforms offer rapid deployment, native cloud warehouse integrations, and drag‑and‑drop dashboards for enterprise reporting and self‑service analytics, enabling faster time‑to‑value.
9. Which SaaS BI platforms offer drag‑and‑drop dashboards with usage‑based pricing and elastic scaling in 2026?
Supaboard, Sigma, Metabase Cloud, and Apache Superset Cloud combine drag‑and‑drop dashboard builders with usage‑based or flexible pricing and elastic cloud scaling. These BI platforms are ideal for teams handling high query volumes while keeping analytics costs predictable.
10. What are some looker like business intelligence platforms?
Looker like business intelligence platforms include tools that offer governed data models, embedded analytics, real-time dashboards, and scalable cloud performance. These platforms are ideal for organizations that need consistent metrics, strong data governance, and customizable analytics similar to what Looker provides.
Conclusion
Business intelligence tools have evolved from basic reporting systems into AI-powered data platforms that deliver real-time insights and support faster, smarter decision-making. In 2026, modern business intelligence tools combine automation, intuitive dashboards, and advanced analytics to help organizations turn complex data into clear, actionable outcomes.
Choosing the right business intelligence tools requires aligning them with your business goals, data complexity, and team capabilities. Focus on platforms that offer strong data integration, ease of use, and scalability to ensure long-term value. Testing tools through trials or demos can help you understand how effectively they fit your workflows and support real-world decision-making.
Ultimately, the right business intelligence tools enable organizations to move from data collection to insight-driven action, improving efficiency, uncovering opportunities, and maintaining a competitive advantage in a data-driven environment.