
Financial Dashboards: A Practical Guide for Teams
Learn what financial dashboards are, why they matter, key benefits, examples, and how to build dashboards that support smarter business decisions.


Introduction
If you’ve ever stared at a spreadsheet full of numbers and still felt unsure about what to do next, you’re not alone.Most businesses already have financial data, sales reports, expense sheets, bank statements, accounting software exports. The problem isn’t missing data. It’s missing clarity.
A financial dashboard exists to solve exactly that.
At its best, a financial dashboard shows you the state of your business at a glance. No spreadsheets to clean. No manual reports to prepare. No finance jargon to decode. Just clear numbers that help you act faster and with more confidence.
You don’t need to be a finance expert or a technical person to use one. If you run a business, manage money, or make decisions based on numbers, a well-built financial dashboard can save time, reduce confusion, and prevent costly mistakes.
This guide explains what financial dashboards really are, why they matter more than ever, and how to build one that actually supports real decisions, using simple language and practical examples.
What Is a Financial Dashboard?
A financial dashboard is a single visual view of your most important financial numbers, presented in a way that’s easy to understand and quick to act on.Instead of digging through multiple reports, you see charts, totals, and trends that update automatically. The goal is not accounting compliance or detailed auditing, it’s decision-making.
Unlike traditional financial reports, dashboards are:
Easy to read, even for non-finance users
Updated frequently (daily or near real time)
Focused only on metrics that drive action
Think of a dashboard as the difference between reading a full medical report and checking your vital signs. Both matter, but one helps you react immediately.
Why Financial Dashboards Matter More Than Ever?
Many teams believe they have a finance problem, when in reality they have a visibility problem.
Without a dashboard, teams often struggle with:
Decisions delayed because reports take too long
Hours wasted every week updating spreadsheets
Uncertainty around cash flow and profitability
No clear understanding of where money is actually going
In fast-moving businesses, waiting days or weeks to understand your financial position is risky. Leaders should be able to answer basic questions almost instantly:
Are we making money right now?
Where are we overspending?
How long will our cash last at this pace?
Financial dashboards are especially valuable for:
Founders who want real control over cash and growth
Finance teams tired of repetitive manual reporting
CFOs tracking performance, risk, and forecasts
Operators making day-to-day decisions that affect margins
In short, dashboards help businesses move faster, stay grounded in reality, and avoid unpleasant surprises.
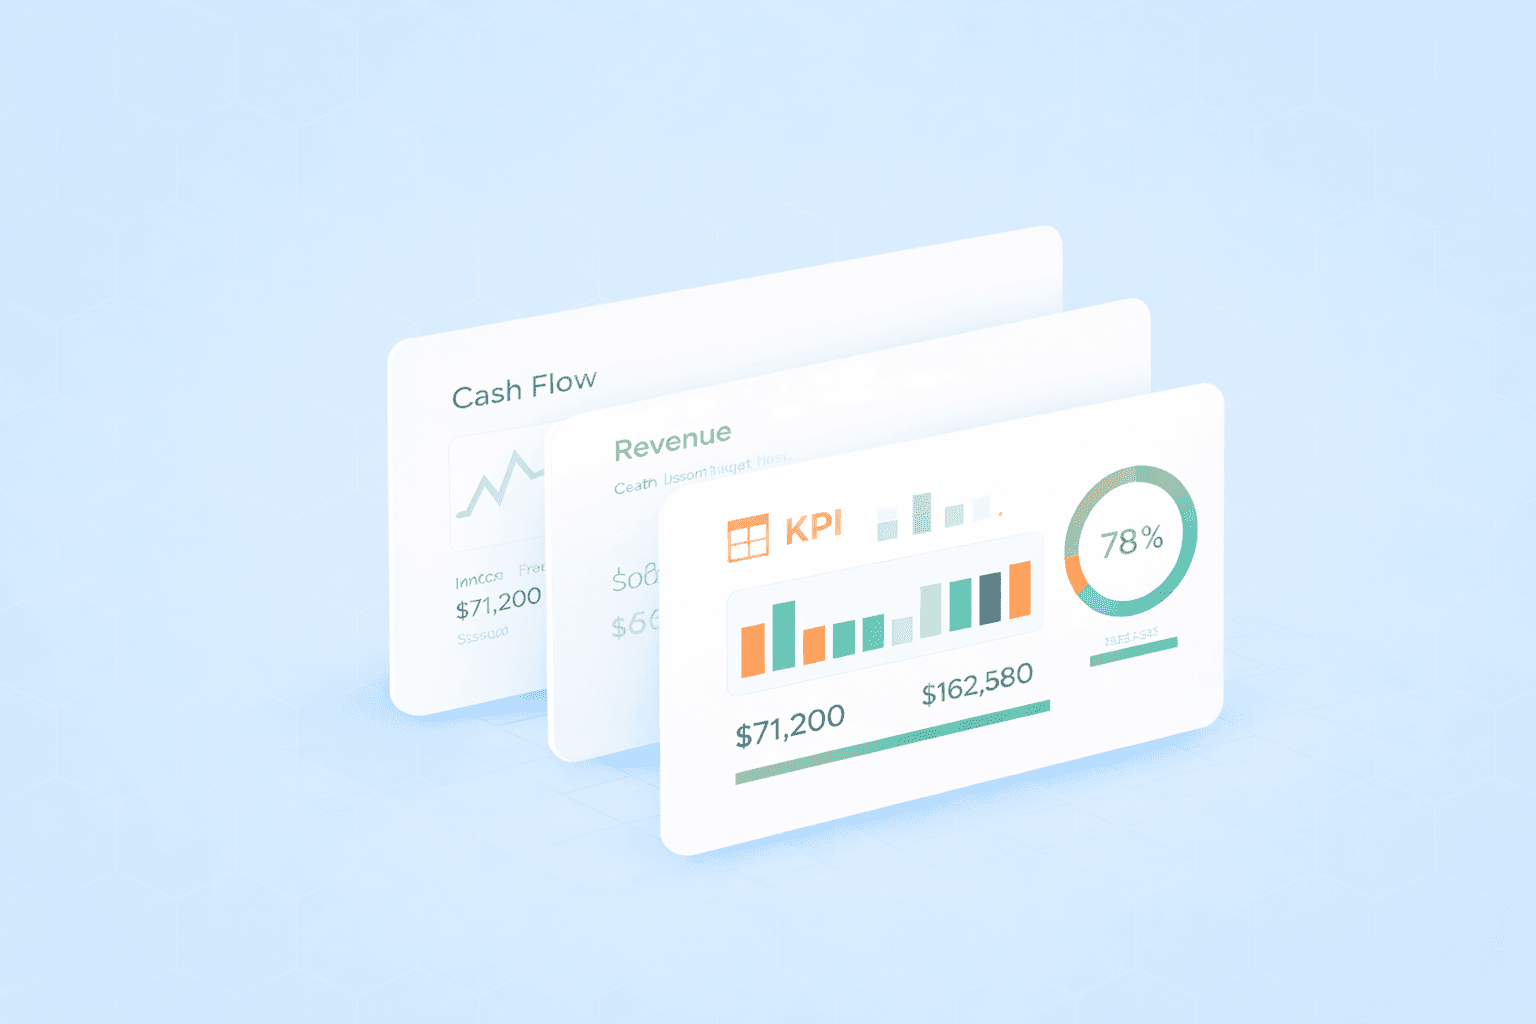
What You’ll Typically See on a Financial Dashboard
Most effective financial dashboards focus on the essentials:
Revenue (total and trends)
Expenses (by category or department)
Cash balance and cash flow
Profit or loss
Comparisons over time (month-over-month, year-over-year)
Some dashboards also include forecasts, budgets, or targets, but only when those numbers help guide decisions.
What Makes a Financial Dashboard Actually Useful
A good dashboard is not packed with numbers. It’s designed with intent.
The best dashboards include:
Clear KPIs tied to decisions (not vanity metrics)
Simple visuals instead of dense tables
Comparisons (actual vs plan, this month vs last month)
Trends over time, not just point-in-time values
Filters or drill-downs to explore details when needed
The goal isn’t to show everything, it’s to show what matters most right now. If someone can’t understand the dashboard in under a minute, it’s probably too complex.
Types of Financial Dashboards
Different teams need different views. The best dashboards are built around the decisions they support.
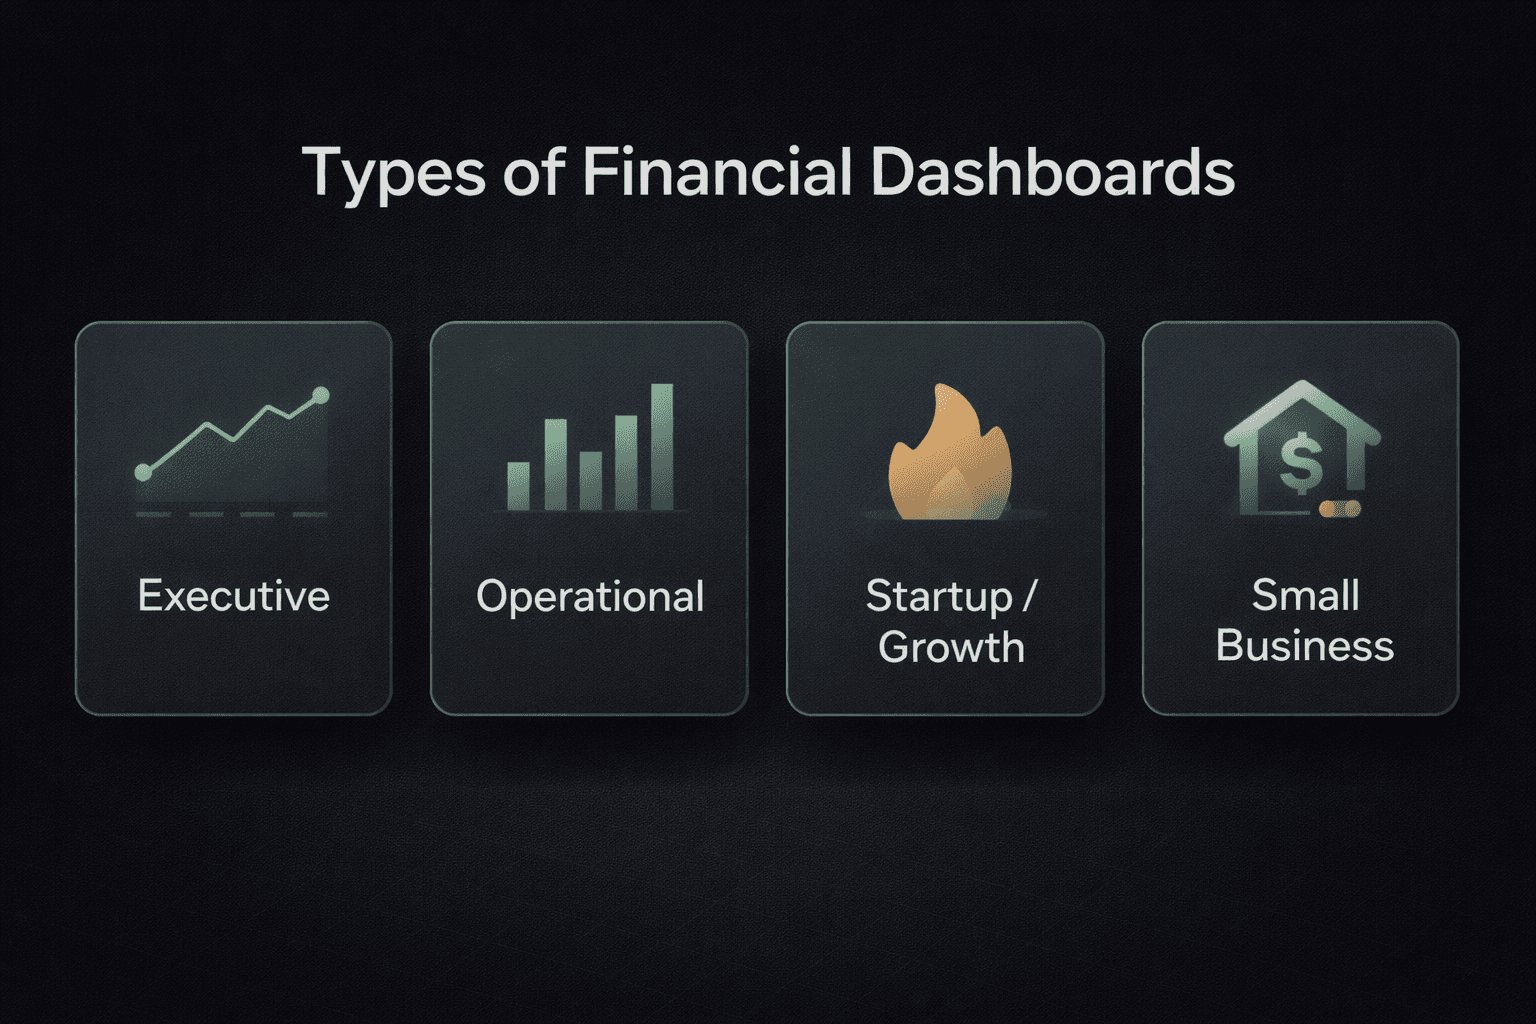
Executive or Leadership Dashboards
These provide a high-level view of overall financial health. They help founders, CEOs, and leadership teams quickly assess performance, spot trends, and compare actual results against goals or forecasts, without diving into operational details.
Typical focus:
Revenue growth
Profitability
Cash position
High-level risks
Operational and Reporting Dashboards
Designed for finance and operations teams, these dashboards support day-to-day and monthly tracking. They often include department-wise expenses, budget vs actuals, and recurring financial reports that help teams stay on track and control costs.
Typical focus:
Expense control
Budget adherence
Department performance
Startup and Growth Dashboards
Common in early-stage and fast-growing companies, these dashboards focus on survival and scale. Metrics like burn rate, cash runway, revenue growth, and unit economics guide fundraising and growth decisions.
Typical focus:
Burn rate
Runway
Growth trends
Small Business or Personal Dashboards
These dashboards simplify money management for small teams or individuals. They help track income, expenses, budgets, and savings without the complexity of enterprise accounting systems.
Tip: Always choose a dashboard based on the decisions you need to make, not on how advanced or impressive it looks.
How Financial Dashboards Improve Decision-Making
The biggest benefit of a financial dashboard is speed.
When everything lives in one place, you don’t need to wait for reports or ask someone to “pull the numbers.” You can see what’s happening and act immediately.
Teams typically experience:
Faster identification of problems and opportunities
Better cash planning and cost control
Clearer conversations with partners, investors, and stakeholders
Less time spent preparing and explaining reports
When everyone looks at the same numbers, decisions become simpler, more aligned, and more confident.
How to Build a Financial Dashboard (Step by Step)
Step 1: Be Clear About the Purpose
Start with two questions:
What decisions should this dashboard support?
Who will actually use it?
A clear purpose keeps the dashboard focused and prevents unnecessary clutter.
Step 2: Choose the Right Metrics
Resist the urge to track everything. Focus on numbers that drive action. For most businesses, this includes:
Revenue
Expenses
Cash flow
Profit or margin
Add more metrics only when they clearly improve decisions.
Step 3: Get Your Data in Order
Dashboards are only as good as the data behind them. Ensure:
Consistent categories
Clear definitions
Matching time periods across metrics
If the data is messy, the dashboard will be misleading.
Step 4: Keep the Design Simple
Clarity beats beauty. Use:
Clean charts
Clear labels
Obvious trends
If someone can’t understand the dashboard quickly, simplify it.
Step 5: Review and Evolve
Dashboards aren’t “set and forget.” Review them regularly, validate accuracy, and update metrics as your business changes.
What Good Financial Dashboards Look Like in Practice
Strong dashboards usually make it easy to answer:
How revenue is trending
Where money is being spent
Whether cash is increasing or decreasing
How profitability is changing over time
A simple test: after looking at the dashboard, do you know what action to take next? If yes, it’s doing its job.
Templates vs Custom Dashboards
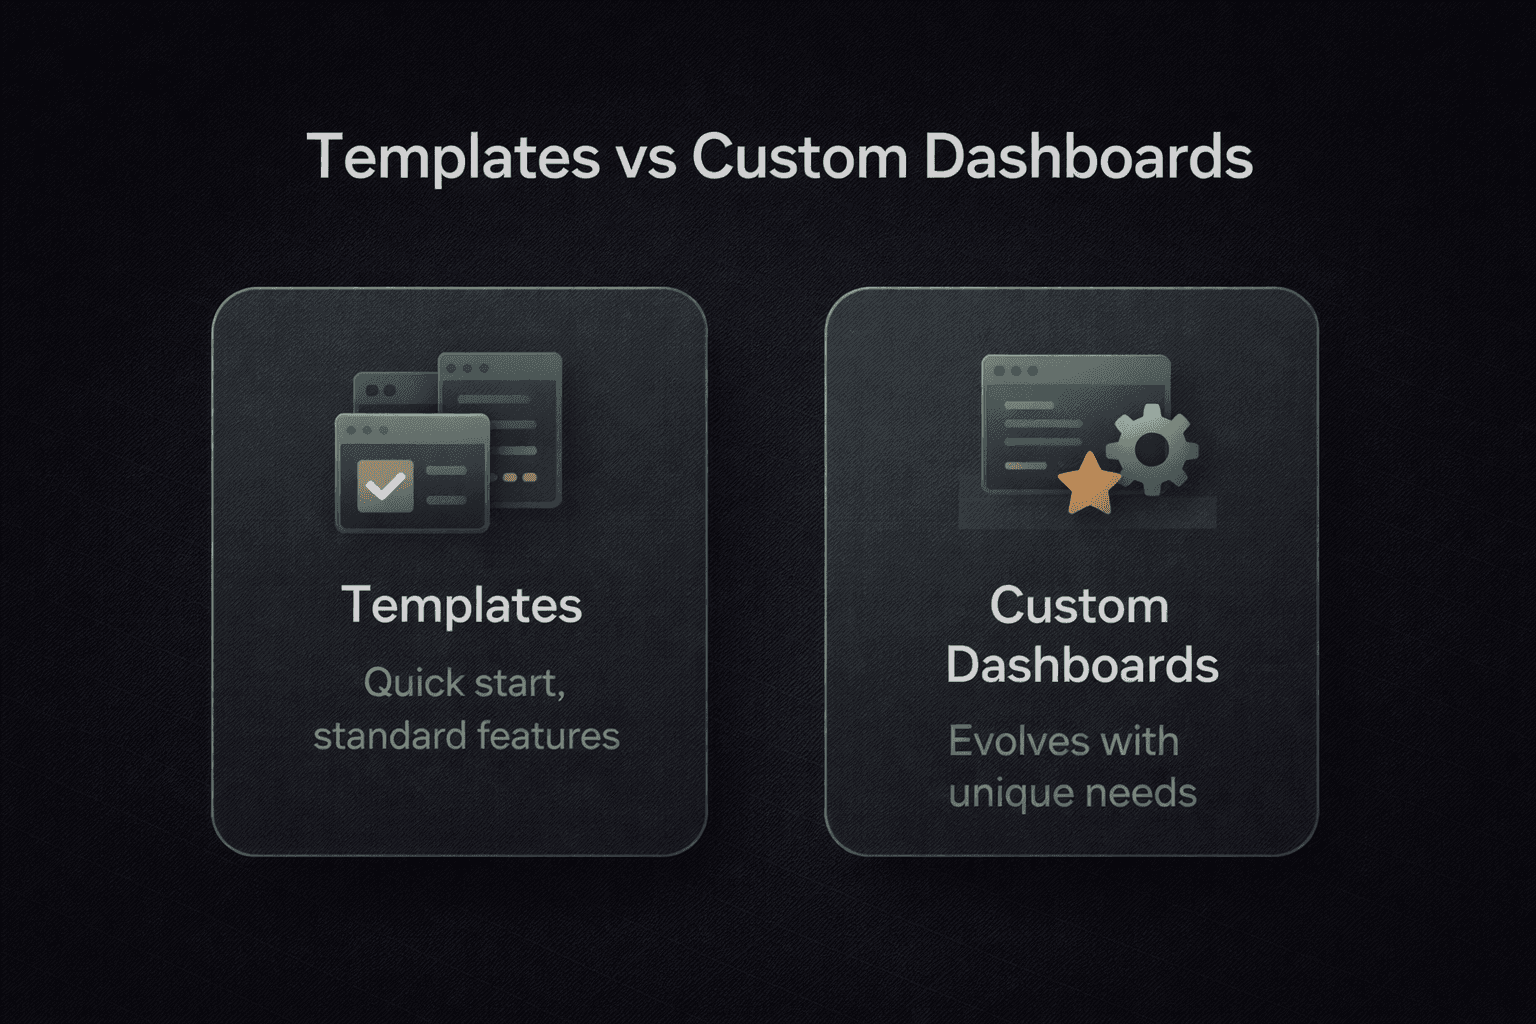
Templates
Templates are useful for getting started quickly, especially for standard use cases or early-stage businesses. They provide structure and reduce setup time.
Custom Dashboards
Custom dashboards adapt to how your business actually operates. They evolve with your strategy and reflect the questions your team asks most often.
Recommendation: Start with a template. Move to custom dashboards as your needs become more specific.
Gartner Insight: Financial Dashboards That Actually Drive Decisions
Many dashboards fail because they focus on reporting, not action. According to Gartner, effective dashboards are decision-focused, streamlined, and intuitive for all users. Finance teams should prioritize metrics tied to real business problems, like cash flow or expense variances, and include alerts for unusual trends.
For example, a financial services firm redesigned its dashboards to highlight key KPIs and enable drill-downs. Leadership could respond within hours to changes instead of waiting for weekly reports, improving agility and alignment.
Know More: About Top BI Tools in 2026
Common Mistakes to Avoid
Even experienced teams fall into these traps:
Tracking too many metrics
Using outdated or incorrect data
Overcomplicating visuals
Forgetting to maintain dashboards
Building dashboards without a clear goal
Simple, focused dashboards consistently outperform complex ones.
Frequently Asked Questions (FAQs)
How frequently should financial dashboards update?
Financial dashboards should update daily to provide timely insights. Real-time updates are crucial for fast-paced environments, enabling businesses to make decisions based on the most current data available, allowing for swift action on emerging trends.
Which KPIs should financial dashboards track?
The key performance indicators (KPIs) most commonly tracked include revenue, expenses, cash flow, and profit. These KPIs provide the essential insights needed for financial health, allowing businesses to track their financial stability and make informed decisions based on trends.
Are financial dashboards beneficial for small businesses?
Yes, financial dashboards are incredibly useful for small businesses, especially when resources are limited. They consolidate financial data, provide clear visualizations, and enable quick decision-making. This helps small businesses manage their budgets, track cash flow, and prevent financial mismanagement.
What are the key benefits of using a financial dashboard?
A financial dashboard offers real-time insights, streamlined decision-making, and enhanced transparency. It helps businesses track performance, manage cash flow, identify risks, and monitor KPIs more effectively, leading to improved financial planning, better risk management, and more informed decisions.
Why Dashboards Matter More Than Reports?
A financial dashboard is not just a reporting tool. It’s a decision system.Reports explain what happened in the past. Dashboards help you understand what’s happening now and what to do next. When dashboards answer real questions, provide context, and are usable by non-technical teams, they become part of daily operations instead of monthly paperwork.
Build Financial Dashboards That Actually Drive Action: with Supaboard
Building a financial dashboard isn’t just about visualizing numbers. It’s about making those numbers actionable for the people who run the business.
That’s where tools like Supaboard come in.
Supaboard helps teams move beyond static dashboards and manual reporting by letting business users:
Ask questions in plain English(Natural Language Query) instead of writing SQL
Instantly explore financial data across sources
Turn answers into live dashboards without engineering help
Share clear, decision-ready insights with the entire team
Instead of spending time pulling reports, teams can focus on understanding what’s changing, why it’s happening, and what to do next.
If your goal is to build financial dashboards that are actually used, daily, across teams, and tied to real decisions, Supaboard helps bridge the gap between raw data and action.
Final Thoughts
A financial dashboard isn’t about fancy charts. It’s about clarity. Start small. Focus on the numbers that truly matter. Improve over time. When built well, a financial dashboard becomes a daily tool that keeps your business informed, confident, and in control. That’s when numbers stop being confusing and start being useful.


