
What is a KPI? Real Examples for SaaS & Business Teams
Learn what KPIs really mean, see 15 real-world examples, and discover how to choose the right metrics for your business growth.


In today’s data-driven business environment, organizations collect information from marketing platforms, websites, financial systems, customer platforms, and internal software. However, having access to large volumes of data does not automatically lead to better business decisions. Without structured performance measurement systems, data often remains disconnected from real outcomes, causing delayed actions, misaligned strategies, and missed growth opportunities.
This is where Key Performance Indicators (KPIs) become essential.
Understanding what is a KPI helps organizations transform raw numbers into meaningful business insights that support strategic planning, operational improvement, and long-term growth. Instead of relying on assumptions, KPIs enable leaders to make decisions based on verified performance data.
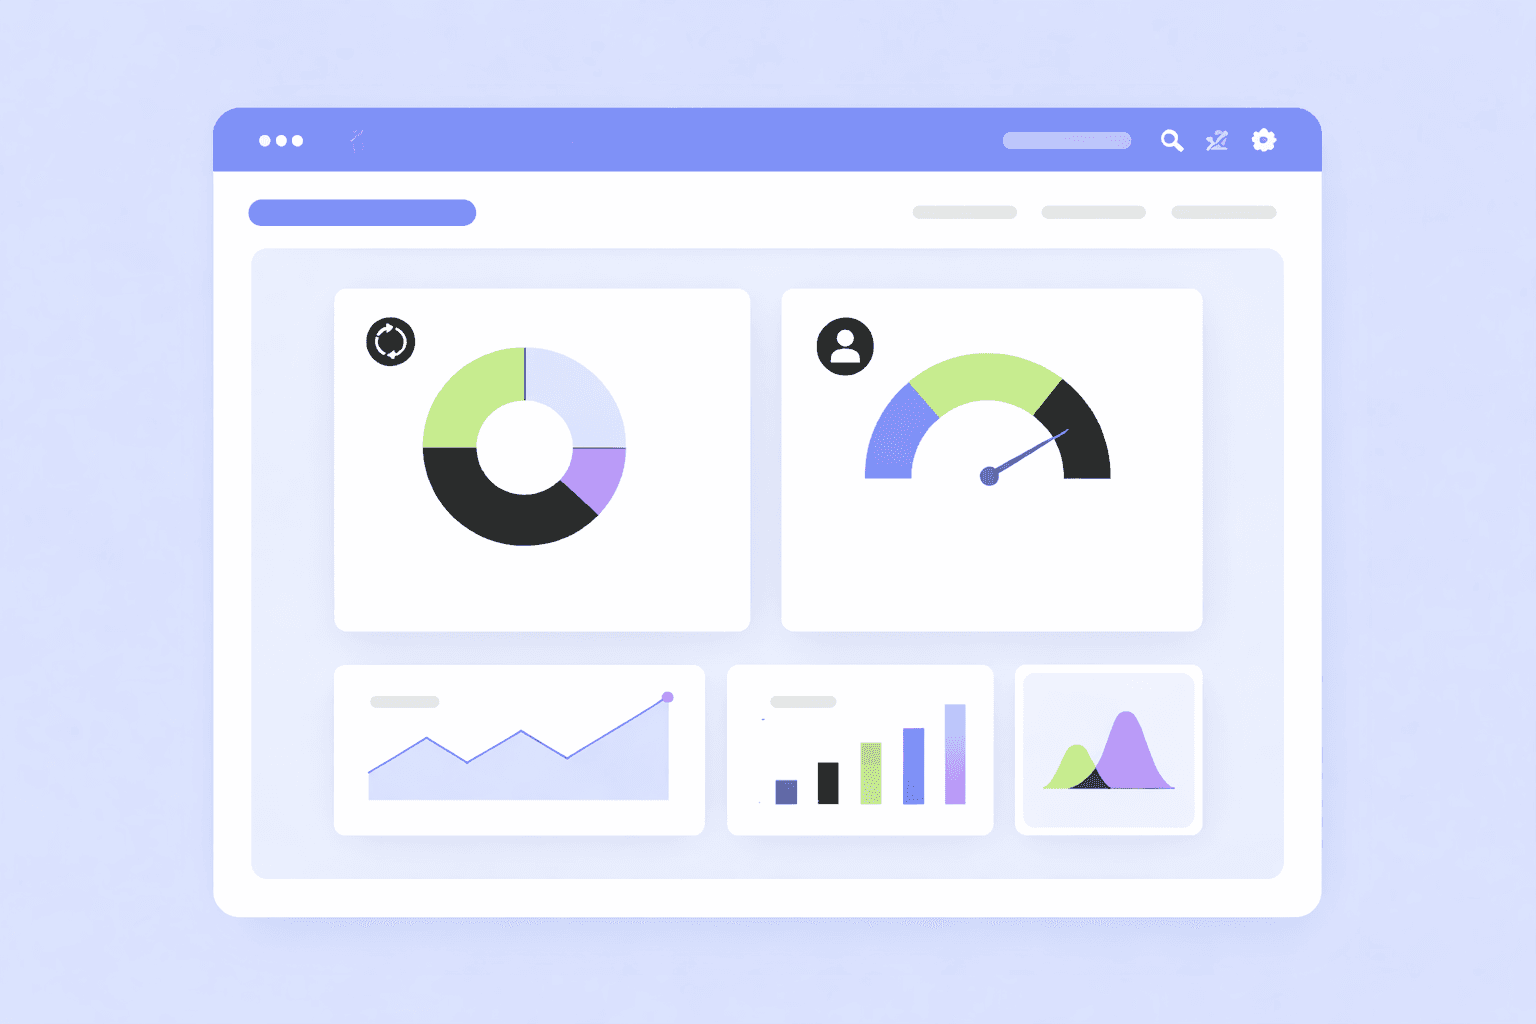
This guide explains what KPIs are, why they matter, how to select the right ones, and how to use modern KPI dashboards to track and manage performance effectively.
What Is a KPI?
A Key Performance Indicator (KPI) is a measurable value that shows how effectively an organization is achieving its business objectives. KPIs convert operational data into strategic insights, guiding leadership decisions and driving accountability across teams.
Key – focuses only on the most important indicators.
Performance – reflects how well the business is operating.
Indicator – shows whether goals are being achieved or require adjustment.
In practice, a KPI tells you whether your organization is moving in the right direction.
Example: A SaaS company tracks monthly recurring revenue (MRR) growth. If MRR declines, leaders can analyze churn, pricing, or acquisition strategies before financial performance is affected.
Unlike general metrics, KPIs are selected intentionally and monitored continuously to support long-term success.
Why KPIs Are Important for Business Success
Without KPIs, businesses rely on fragmented reports, opinions, and outdated spreadsheets. This creates confusion, slows decision-making, and weakens accountability.
KPIs bring structure, clarity, and alignment.
They help leaders:
Identify performance gaps
Monitor progress toward goals
Evaluate investments and initiatives
Connect employee efforts to company objectives
When implemented correctly, KPIs promote transparency, improve team performance, and encourage responsible decision-making.
Organizations with a strong KPI framework are better prepared to adapt to market changes, manage risks, and pursue growth opportunities with confidence.
KPI vs Metric vs KPA: Understanding the Difference
Feature | KPI (Key Performance Indicator) | Metric | KPA (Key Performance Area) |
|---|---|---|---|
Focus | Outcome-oriented | Activity-oriented | Performance driver |
Purpose | Tracks progress toward strategic objectives | Monitors general activity | Highlights areas of accountability and improvement |
Timeframe | Medium to long-term | Short-term | Initiative-dependent |
Decision Impact | Guides executive and leadership decisions | Supports analysis and reporting | Helps managers focus on improvement initiatives |
Example | Customer retention rate | Website visits | Team performance score |
Role in Organization | Drives strategy and growth | Tracks operational activity | Ensures key areas of the business are performing optimally |
Metrics explain what is happening. KPIs explain whether it matters. KPAs ensure accountability in key areas.
High-performing organizations use metrics for monitoring, KPIs for leadership decisions, and KPAs for targeted improvements.
Types of KPIs
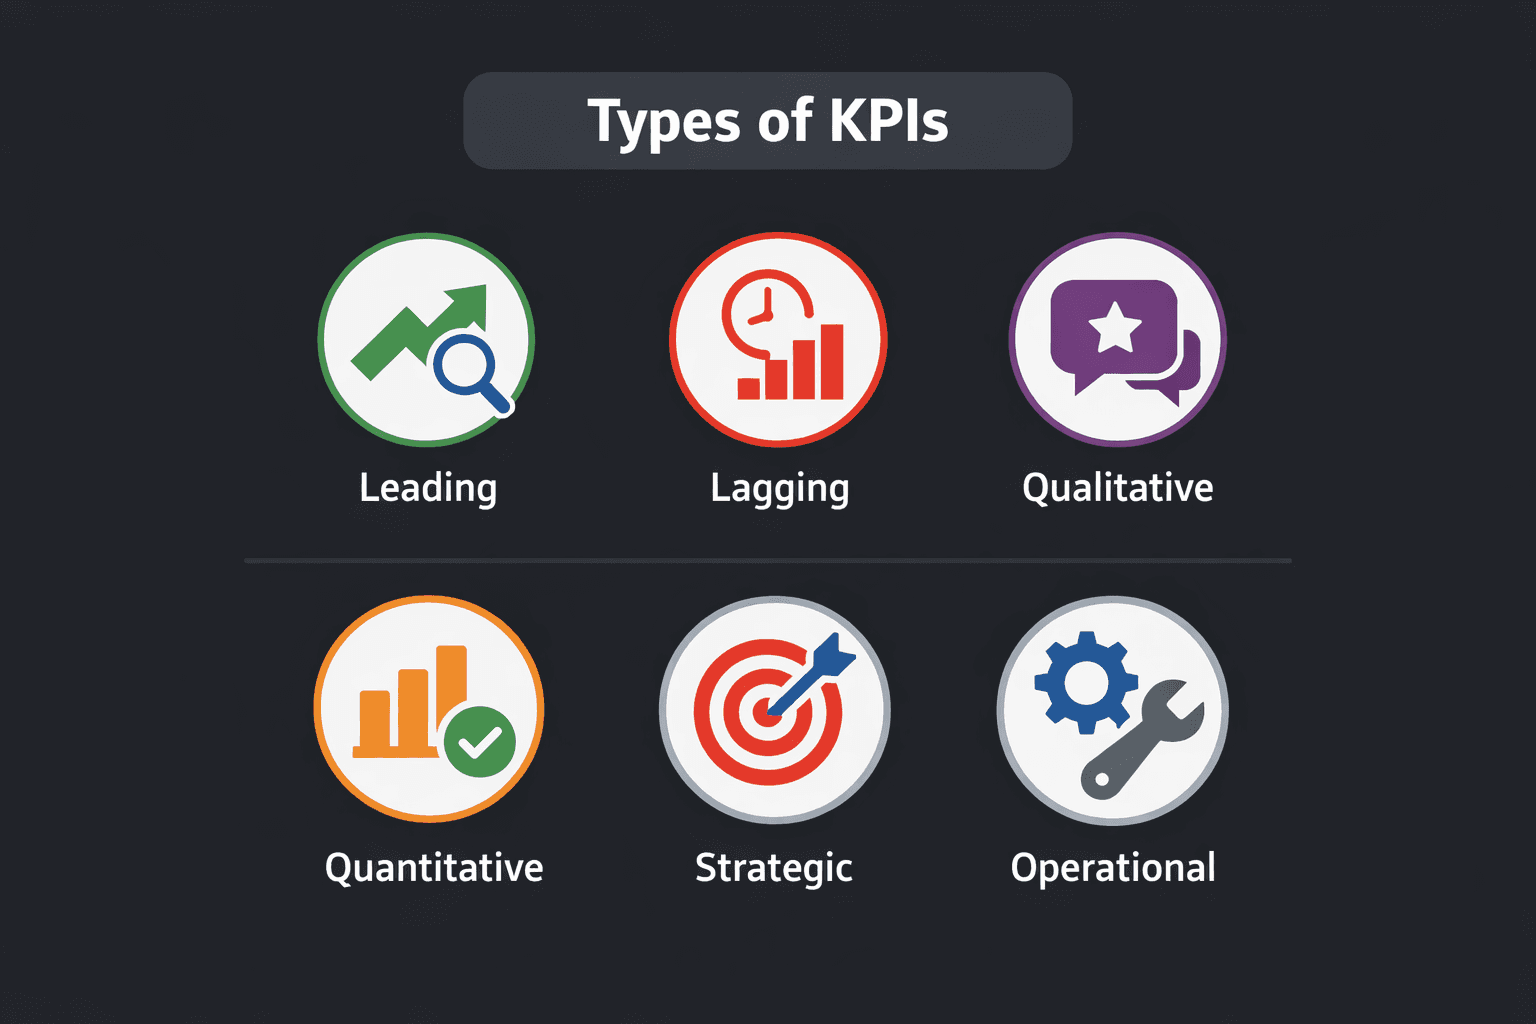
Leading and Lagging KPIs
Leading KPIs predict future outcomes and provide early warnings.
Examples: trial signups, website engagement, demo bookingsLagging KPIs measure past performance.
Examples: revenue, profit margin, customer retention
Using both ensures a balance between prediction and validation.
Quantitative and Qualitative KPIs
Quantitative KPIs are numeric, like revenue, growth rate, or cost per lead.
Qualitative KPIs measure perception, like customer satisfaction, employee engagement, and brand reputation.
Together, they give a comprehensive view of performance.
Strategic and Operational KPIs
Strategic KPIs track long-term goals like market expansion, profitability, or product adoption.
Operational KPIs monitor day-to-day activities, such as order processing time or support response rates.
Both are essential for sustainable execution.
Input and Output KPIs
Input KPIs measure effort, e.g., sales calls made or campaigns launched.
Output KPIs measure results, e.g., deals closed or revenue generated.
Understanding this relationship improves process efficiency and accountability.
KPI Frameworks to Strengthen Performance
Balanced Scorecard
Link KPIs to strategy across four perspectives:
Financial – Revenue growth, profit margin
Customer – NPS, retention rate
Internal Processes – Order cycle time, defect rate
Learning & Growth – Employee engagement, skill development
Learn more in our guide on financial dashboards.
OKRs vs KPIs
Objectives and Key Results (OKRs) define ambitious goals
KPIs track performance toward those objectives
SMART KPIs
Effective KPIs are:
Specific
Measurable
Achievable
Relevant
Time-bound
How to Choose the Right KPIs
Identify critical success factors
Review historical performance data
Involve cross-functional teams
Set realistic benchmarks
Regularly audit KPIs
Modern KPI dashboards simplify tracking and reporting, ensuring accuracy and consistency.
KPI Examples by Department
Department | Key KPIs | Example |
|---|---|---|
Sales | Conversion rate, Average deal size | Demo-to-close ratio |
Marketing | Customer acquisition cost, Campaign ROI | Website conversion rate |
Finance | Profit margin, Cash flow | ROI tracking |
Customer Success | Churn rate, Renewal rate, NPS | Support response time |
Operations | Utilization rate, Inventory turnover | Process cycle time |
Aligned KPIs improve cross-functional performance and transparency.
How to Track & Analyze KPIs
Use centralized KPI dashboards
Set thresholds and alerts for early action
Automate reporting to save time
Link KPIs to team goals and ownership
Effective tracking ensures timely insights and faster decision-making.
Common KPI Mistakes to Avoid
Tracking too many indicators → focus on top 5–10 KPIs
Using vanity metrics → measure what truly impacts business
Ignoring trends → monitor leading & lagging KPIs
Poor communication → assign ownership and review regularly
Not revising KPIs → update as strategies evolve
How the Right KPI System Helps You Scale Faster
Manual tracking becomes inefficient at scale
Centralized KPI platforms automate reporting and improve accuracy
Identify conversion gaps and process bottlenecks
Optimize resource allocation and team performance
Companies with structured KPI systems often achieve higher revenue growth, stronger retention, and better operational efficiency. Performance management becomes a competitive advantage.
Use Case: Gartner’s Use of KPIs for Strategic Business Decisions
Gartner effectively uses KPIs to drive strategic decisions. By tracking leading KPIs like customer acquisition and lagging KPIs such as revenue growth, they ensure proactive business management. Gartner's use of financial dashboards and seamless data connectivity allows real-time insights, helping them stay competitive. Their integration of various analytics tools ensures they remain at the forefront of market trends.
Frequently Asked Questions (FAQ)
What is the difference between a KPI and a metric?
A metric measures general business activity, such as website visits, email opens, or support tickets, providing data on what is happening. A KPI is a strategically chosen metric that reflects progress toward critical business goals and guides leadership decisions.
How often should KPIs be reviewed?
KPIs should be reviewed monthly or quarterly to ensure alignment with business objectives. High-growth companies may review weekly to detect early performance risks and trends. Regular reviews allow timely adjustments, improving operational efficiency and strategic decision-making.
What KPIs are best for startups?
Startups often track monthly recurring revenue, customer acquisition cost, churn rate, burn rate, activation rate, and user engagement. These KPIs help founders evaluate product-market fit, manage cash flow, optimize growth strategies, and measure adoption, retention, and scalability.
How do you create effective KPIs?
Effective KPIs are aligned with business objectives, based on accurate data, and set with realistic, measurable targets. Following SMART principles and reviewing KPIs regularly ensures they remain actionable, relevant, and drive continuous improvement and accountability.
What are examples of business KPIs?
Common KPIs include revenue growth, profit margin, customer retention rate, conversion rate, employee productivity, and Net Promoter Score (NPS). They provide insights into financial performance, customer satisfaction, operational efficiency, and overall organizational effectiveness.
Conclusion: Why KPIs Matter More Than Ever
Understanding what is a KPI is essential for modern business leadership.
KPIs connect strategy with execution, transform data into actionable direction, strengthen accountability, and support continuous improvement.By combining well-designed KPIs with reliable analytics systems, organizations can build a performance-driven culture that drives sustainable growth.
Unlock the power of KPIs and performance tracking for your business. Start using modern KPI dashboards and analytics tools today with Supaboard and make data-driven decisions that drive growth.


