
7 Best Business Intelligence Tools in 2026: Top BI Platforms Compared
Not all BI tools are built the same. Compare the 7 best business intelligence platforms in 2026 by features, pricing, and team fit.


7 Best Business Intelligence (BI) Tools in 2026
Business intelligence tools are evolving faster than most teams can adapt. Increasingly, dashboards and reports are being replaced by AI-enabled systems that can answer questions, explain changes and guide decisions in real-time.
But here’s the thing: not all BI tools are built for the same kind of team. Some are built for enterprise reporting, some for modern data stacks, and a new breed is emerging around AI-first analytics and agentic workflows.
In this guide, we’ll review the 7 best BI tools in 2026 based on real use cases (not just lists of features), so you can see which platform really fits how your team works.
At a Glance: 5 Key Takeaways to Select the Best BI Tool
1. AI matters now, but trusted data matters more.
Almost every major BI platform now offers AI in some form. What separates the good ones from the useful ones is whether AI works on top of trusted metrics, semantic models, and governed access. Without that foundation, fast answers can still be wrong.
2. The best BI tool depends on how your team works.
Power BI is especially attractive for Microsoft-heavy companies. Tableau remains strong for visual exploration. Looker is powerful for governed data modeling. ThoughtSpot is built around search and AI. Hex and Lightdash fit modern data teams well. Supaboard is aimed at AI-first, self-service analytics with fast time to value.
3. Pricing structure matters as much as product quality.
Some tools are simple seat-based products. Others combine platform pricing, user pricing, and usage pricing. That changes the real cost fast, especially once adoption grows across teams.
4. Semantic layers are becoming central to modern BI.
As AI gets added to analytics, businesses need consistent definitions for revenue, pipeline, CAC, retention, and every other KPI. That is why semantic models and metric governance are becoming more important, not less.
5. “Best” is no longer one universal answer.
The best BI platform for a startup may be the wrong one for an enterprise finance team. The smartest way to compare BI tools now is by use case: dashboards, self-service analytics, semantic governance, search-based exploration, modern data team workflows, or AI-assisted investigation.
Why This List Focuses on Modern BI Tools
Before we dive into the list, a quick note: This article is not about traditional BI platforms or the most talked-about legacy tools like Power BI, Tableau, or other comparable looker-style options. These tools remain relevant to many organizations, particularly in mature reporting processes in enterprises. However, they are already widely covered across the internet.
This guide takes a different approach. The goal here is to explore newer and more modern BI tools that are often easier to use, faster to adopt, and better suited to teams that want more flexibility from their analytics stack.
Key points:
Focuses on modern BI platforms, not legacy-first tools
Highlights tools that feel easier and more practical to use
Includes platforms built for faster setup and self-service analytics
Explores options that go beyond standard dashboarding
Aims to help teams discover better alternatives for modern workflows
In short, this list is for teams looking beyond traditional BI and exploring tools that feel more intuitive, more flexible, and more aligned with how modern businesses work today.
7 Best BI Tools Shortlist
Supaboard: AI-first business intelligence for faster answers, cleaner dashboards, and smarter decisions.
Sisense: Flexible BI platform built for embedded analytics and complex data environments.
Domo: Cloud-based BI platform focused on real-time visibility, AI, and data products.
Yellowfin BI: Enterprise analytics platform known for embedded BI, storytelling, and automated insights.
Holistics: SQL-first BI platform built for governed reporting and semantic-layer analytics.
Hex: Collaborative analytics workspace uniting SQL, Python, reporting, and AI workflows.
Lightdash: Modern BI platform for dbt teams focused on metrics and semantic clarity.
What Is Business Intelligence?
Business intelligence is the process of taking the business’s raw data and turning it into useful insights for decision making. Practically, this means integrating data sources, defining key metrics, exploring trends, building dashboards, and helping teams get answers faster.
Top 7 Best Business Intelligence Tools in 2026
1) Supaboard
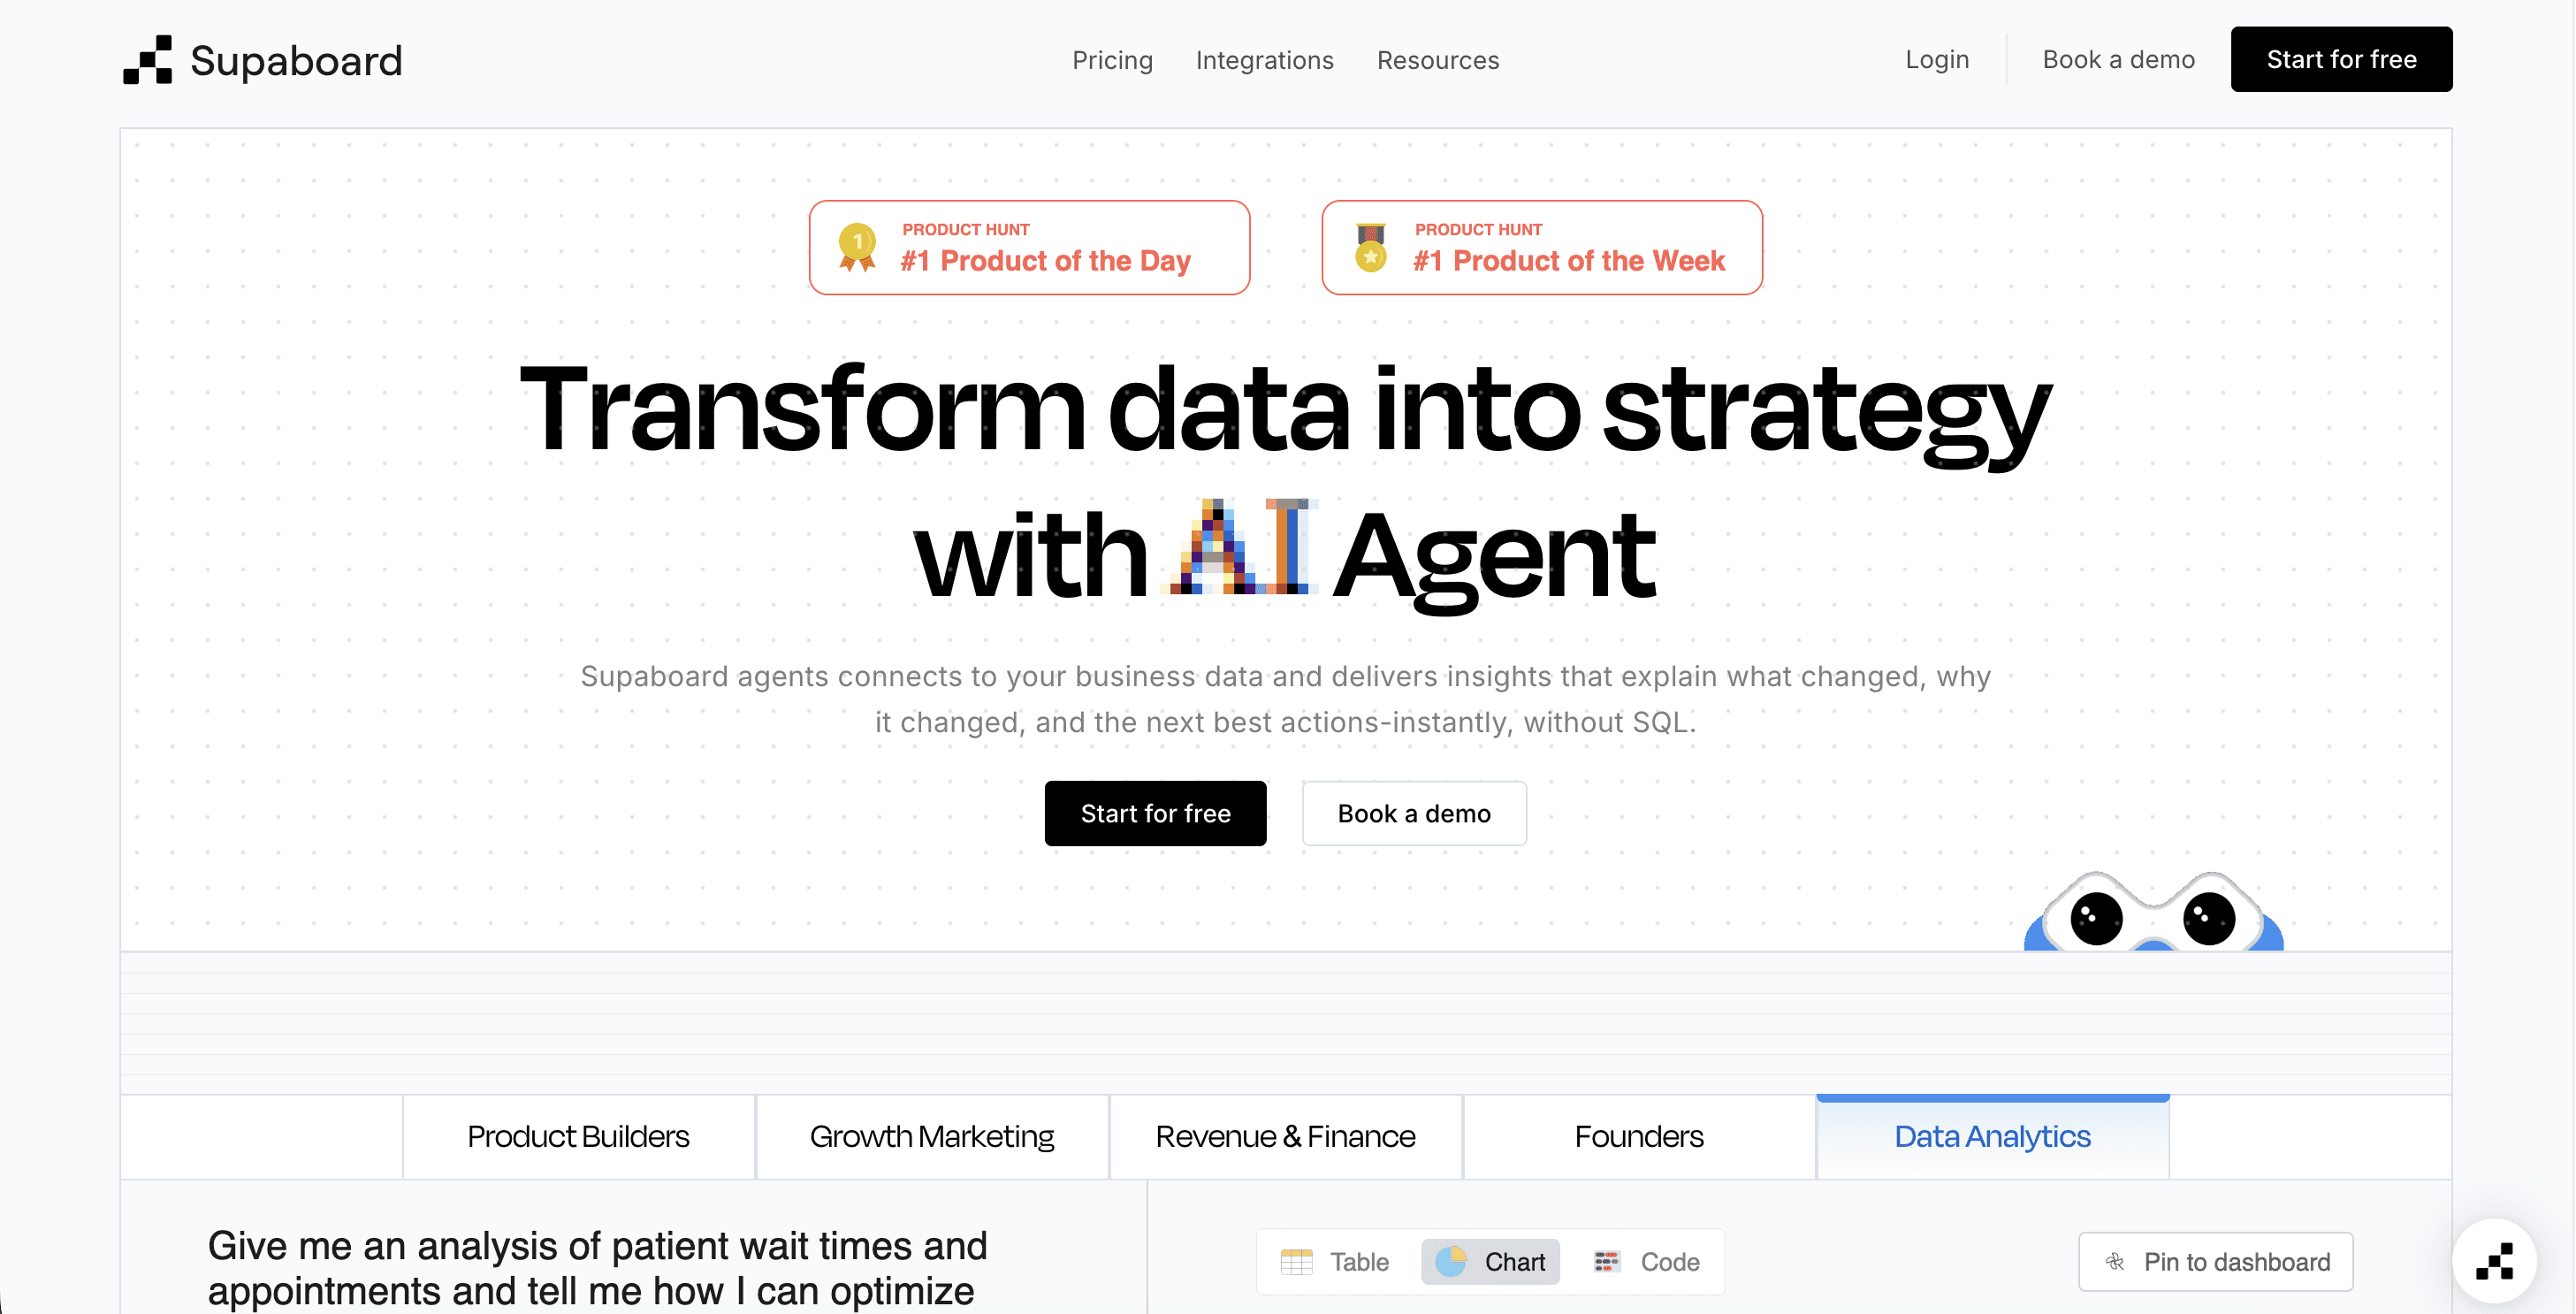
Supaboard is an AI-first business intelligence platform built for teams that want fast answers without a heavy BI setup. It focuses on natural language analysis, quick dashboard generation, and broad connectivity. The product is positioned around helping teams ask questions, generate dashboards in minutes, and collaborate securely with role-based permissions, audit logs, and Slack integration. It is especially appealing for growing teams that want a modern, faster self-service analytics experience.
Top 5 features
Natural language analytics: Ask business questions in plain language and get instant answers, reducing dependency on analysts and making data exploration easier for everyone.
Know more about "How natural language query works"
Dashboard generation in minutes: Create dashboards quickly from prompts or questions, helping teams move from raw data to usable insights without long setup time.
600+ integrations: Connect data from hundreds of tools and databases, so teams can analyze business performance without constantly switching between disconnected platforms.
AI-powered dashboards and pin to dashboard: Generate charts and insights through AI prompts, then pin important outputs to dashboards for faster reporting, monitoring, and team visibility.
AI agents, embedded analytics, and deck features: Use AI agents for guided analysis, embed dashboards into workflows, and create shareable decks that make insights easier to present.
Limitations
Newer and less established than older BI leaders
Fewer long-term third-party comparisons than legacy enterprise products
Advanced enterprise evaluation may still require hands-on review
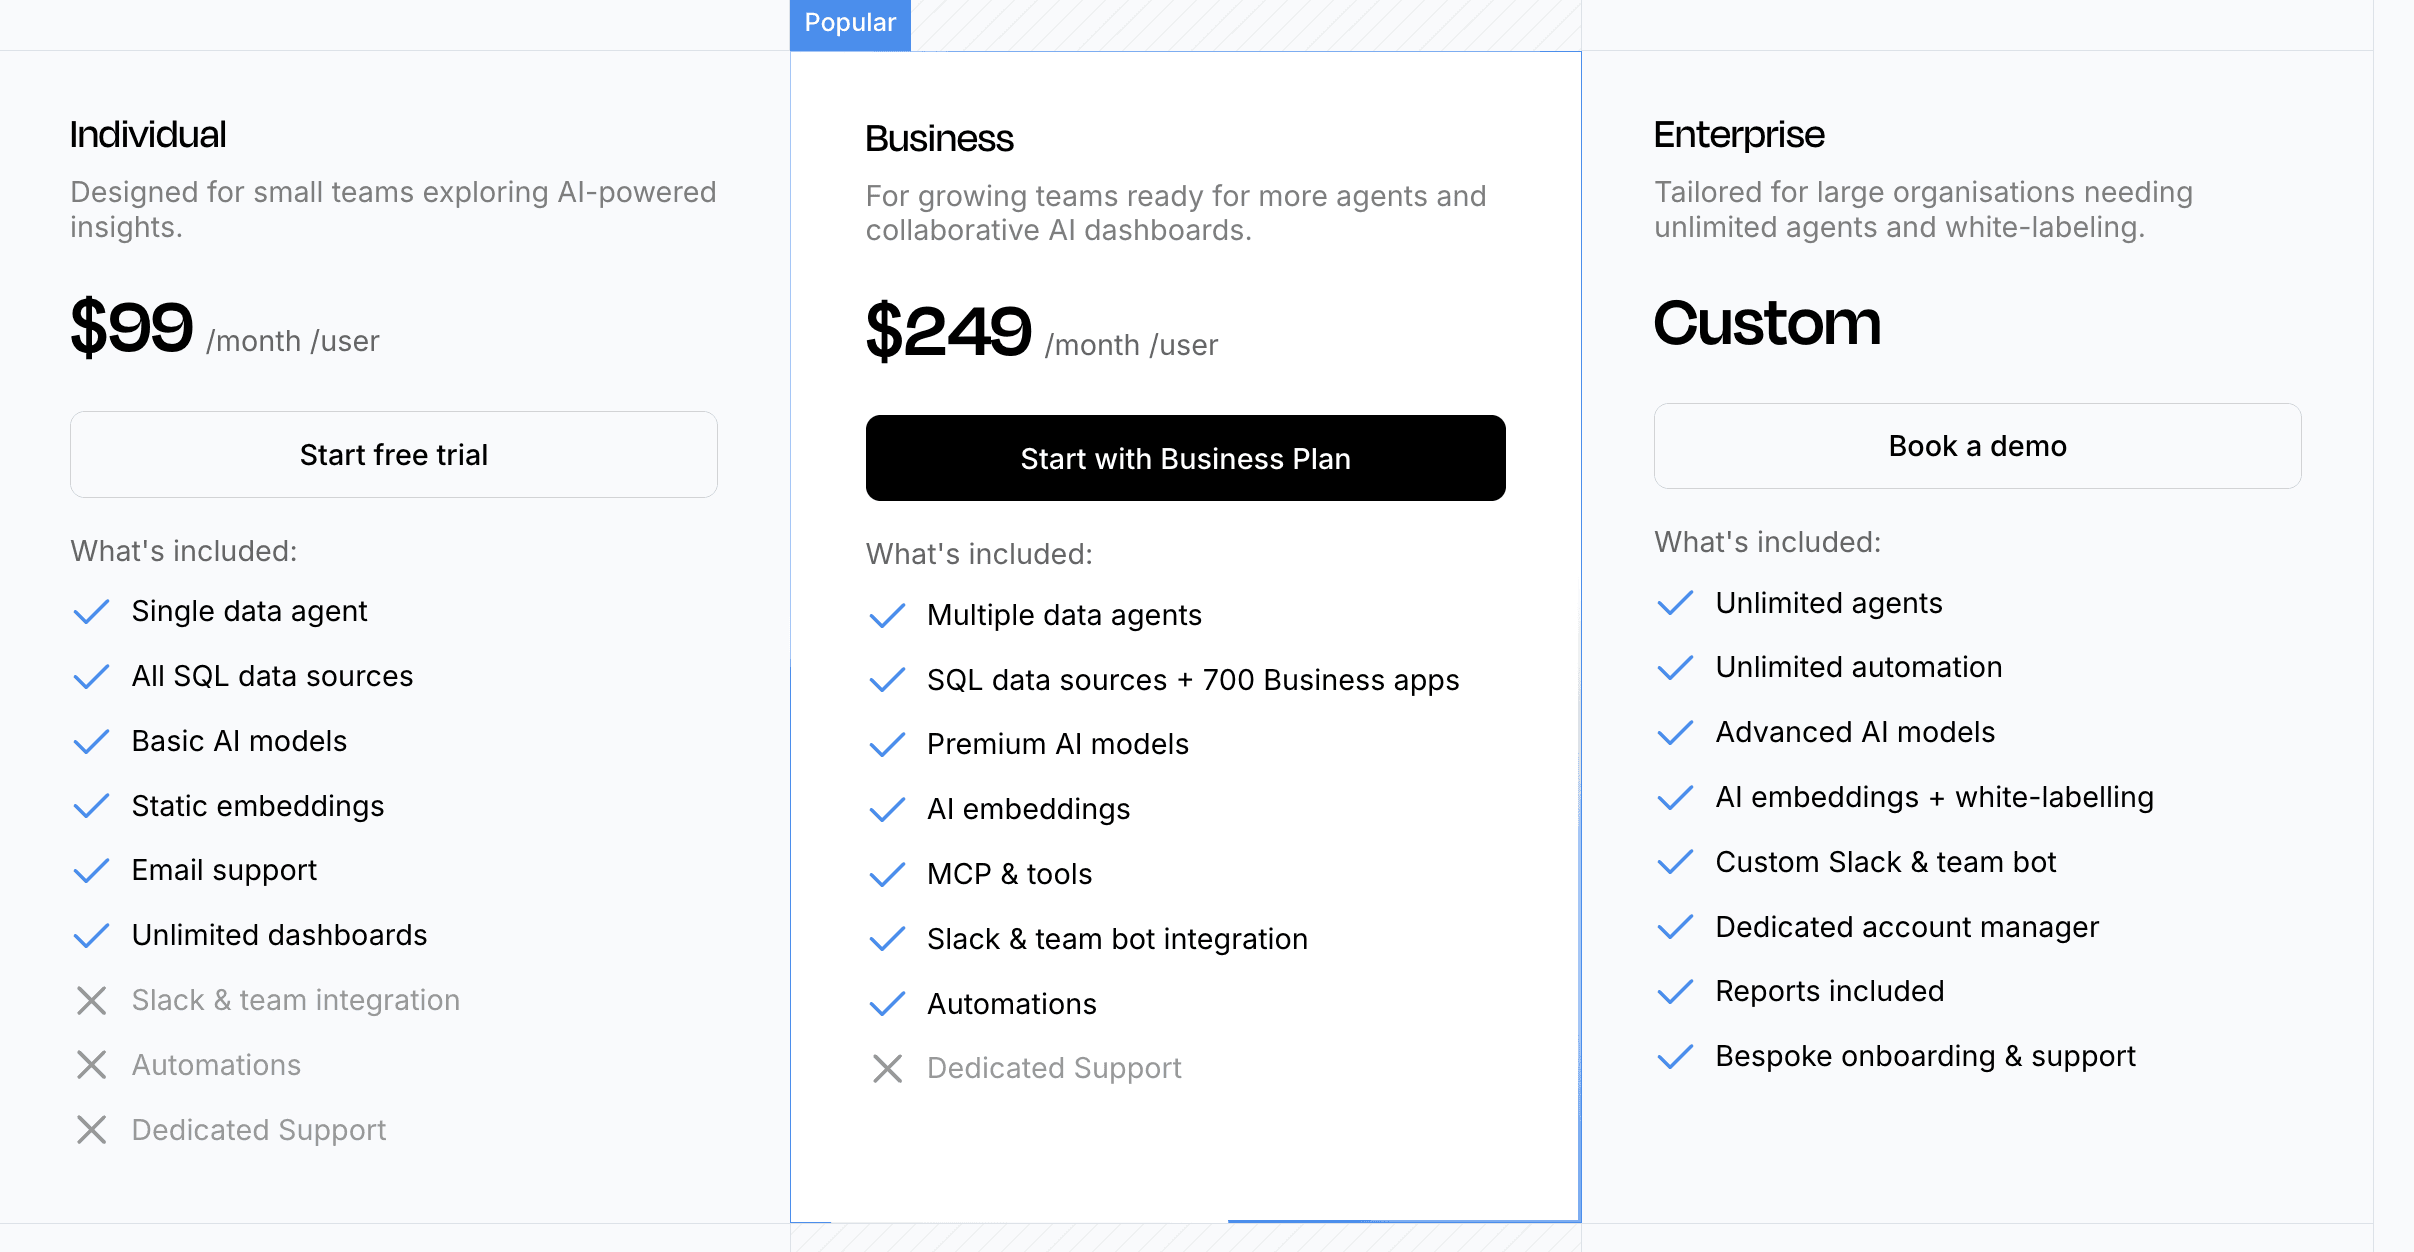
Pricing
14-day free trial available
Individual: $99/month
Business: $250/month
Enterprise: custom pricing
Supaboard is Ideal for:
Companies that want self-service analytics through search, AI-guided exploration, and faster business-user access to answers.
2) Sisense
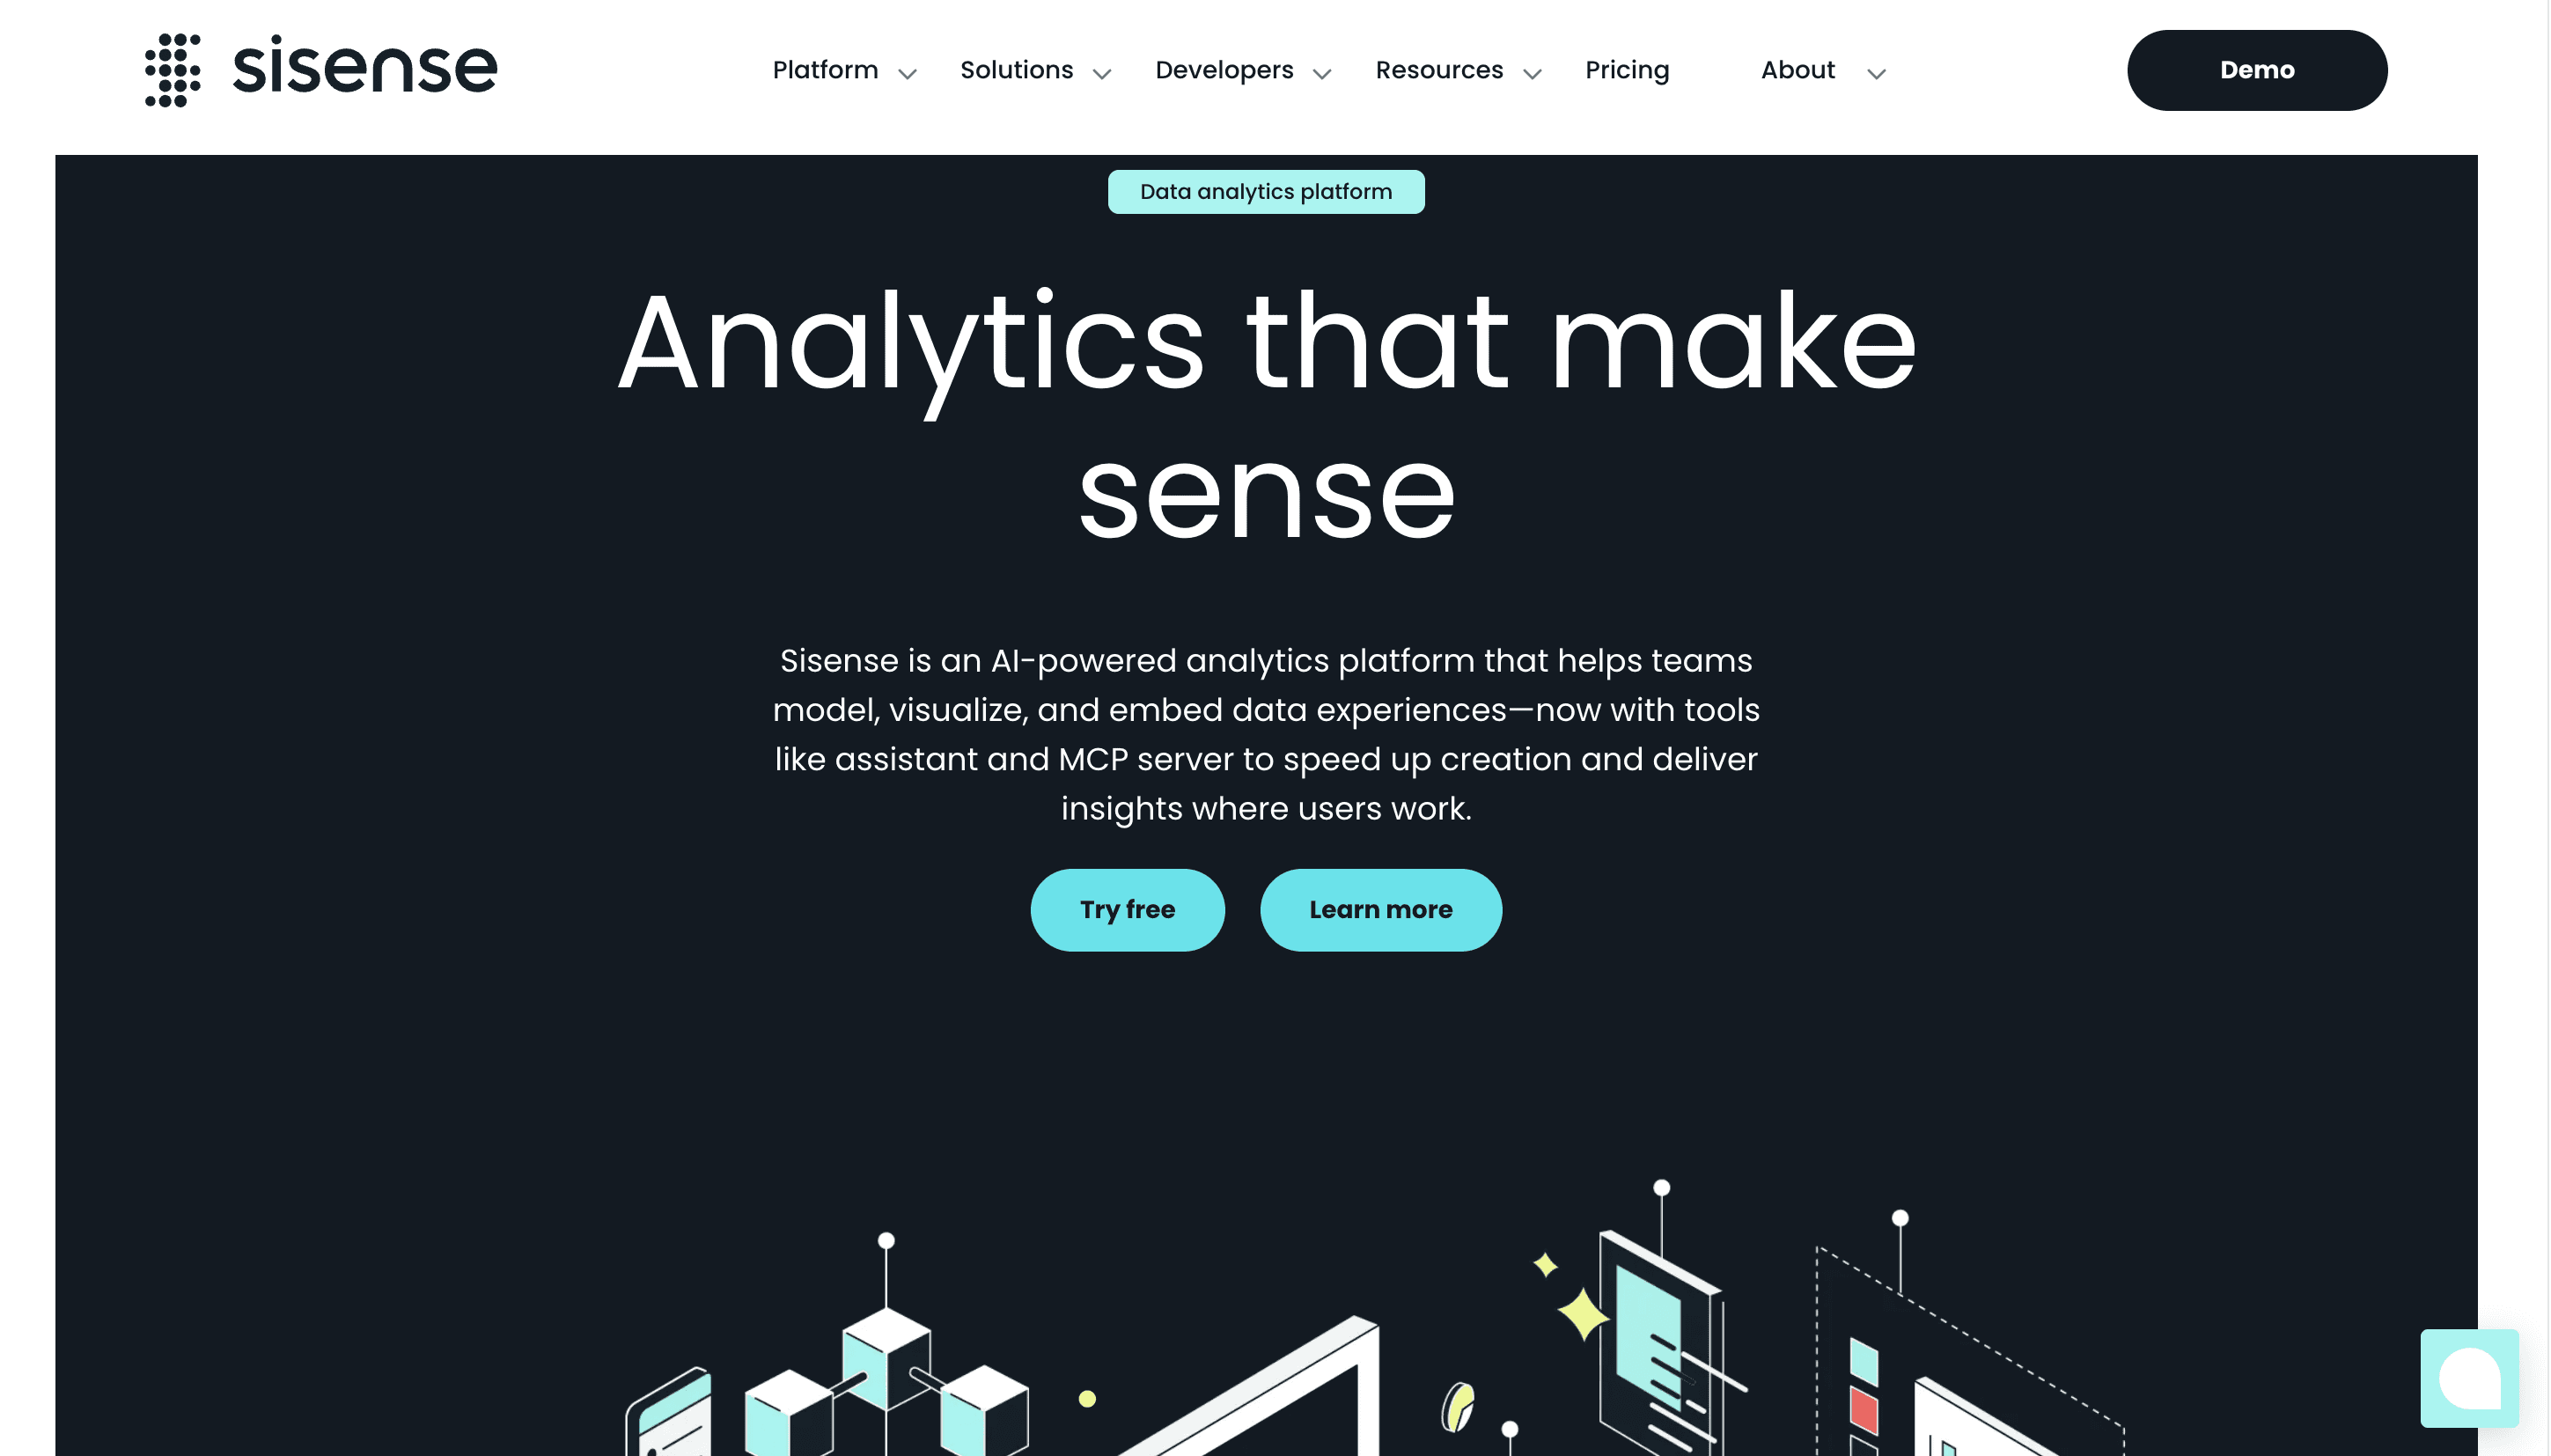
Sisense is a strong choice for companies that care about embedded analytics, flexible deployment, and developer control. Its positioning in 2026 is clearly centered around AI-powered embedded analytics, conversational experiences, Compose SDK, and analytics that fit directly into customer-facing products. It is especially relevant for software companies and enterprises with complex data environments.
Top 5 features
Embedded analytics flexibility: Embed dashboards, analytics, and conversational experiences directly into your product using iframes, SDKs, or API-first approaches.
Compose SDK: Gives developers strong control over how analytics looks and behaves inside applications, making white-label experiences easier to build.
AI-powered conversational analytics: Lets users explore data through natural language, helping non-technical users find answers faster inside embedded or internal analytics flows.
Predictive analytics and anomaly detection: Moves beyond basic BI by surfacing trends, forecasts, and patterns that help users spot issues earlier.
Governed semantic and AI workflows
Its newer AI assistant and MCP-based approach aim to keep AI responses grounded in governed models and access controls.
Limitations
Better suited to embedded and technical use cases than simple business-user BI
Pricing climbs quickly beyond entry plans
May be more than smaller teams need
Sisense Pricing
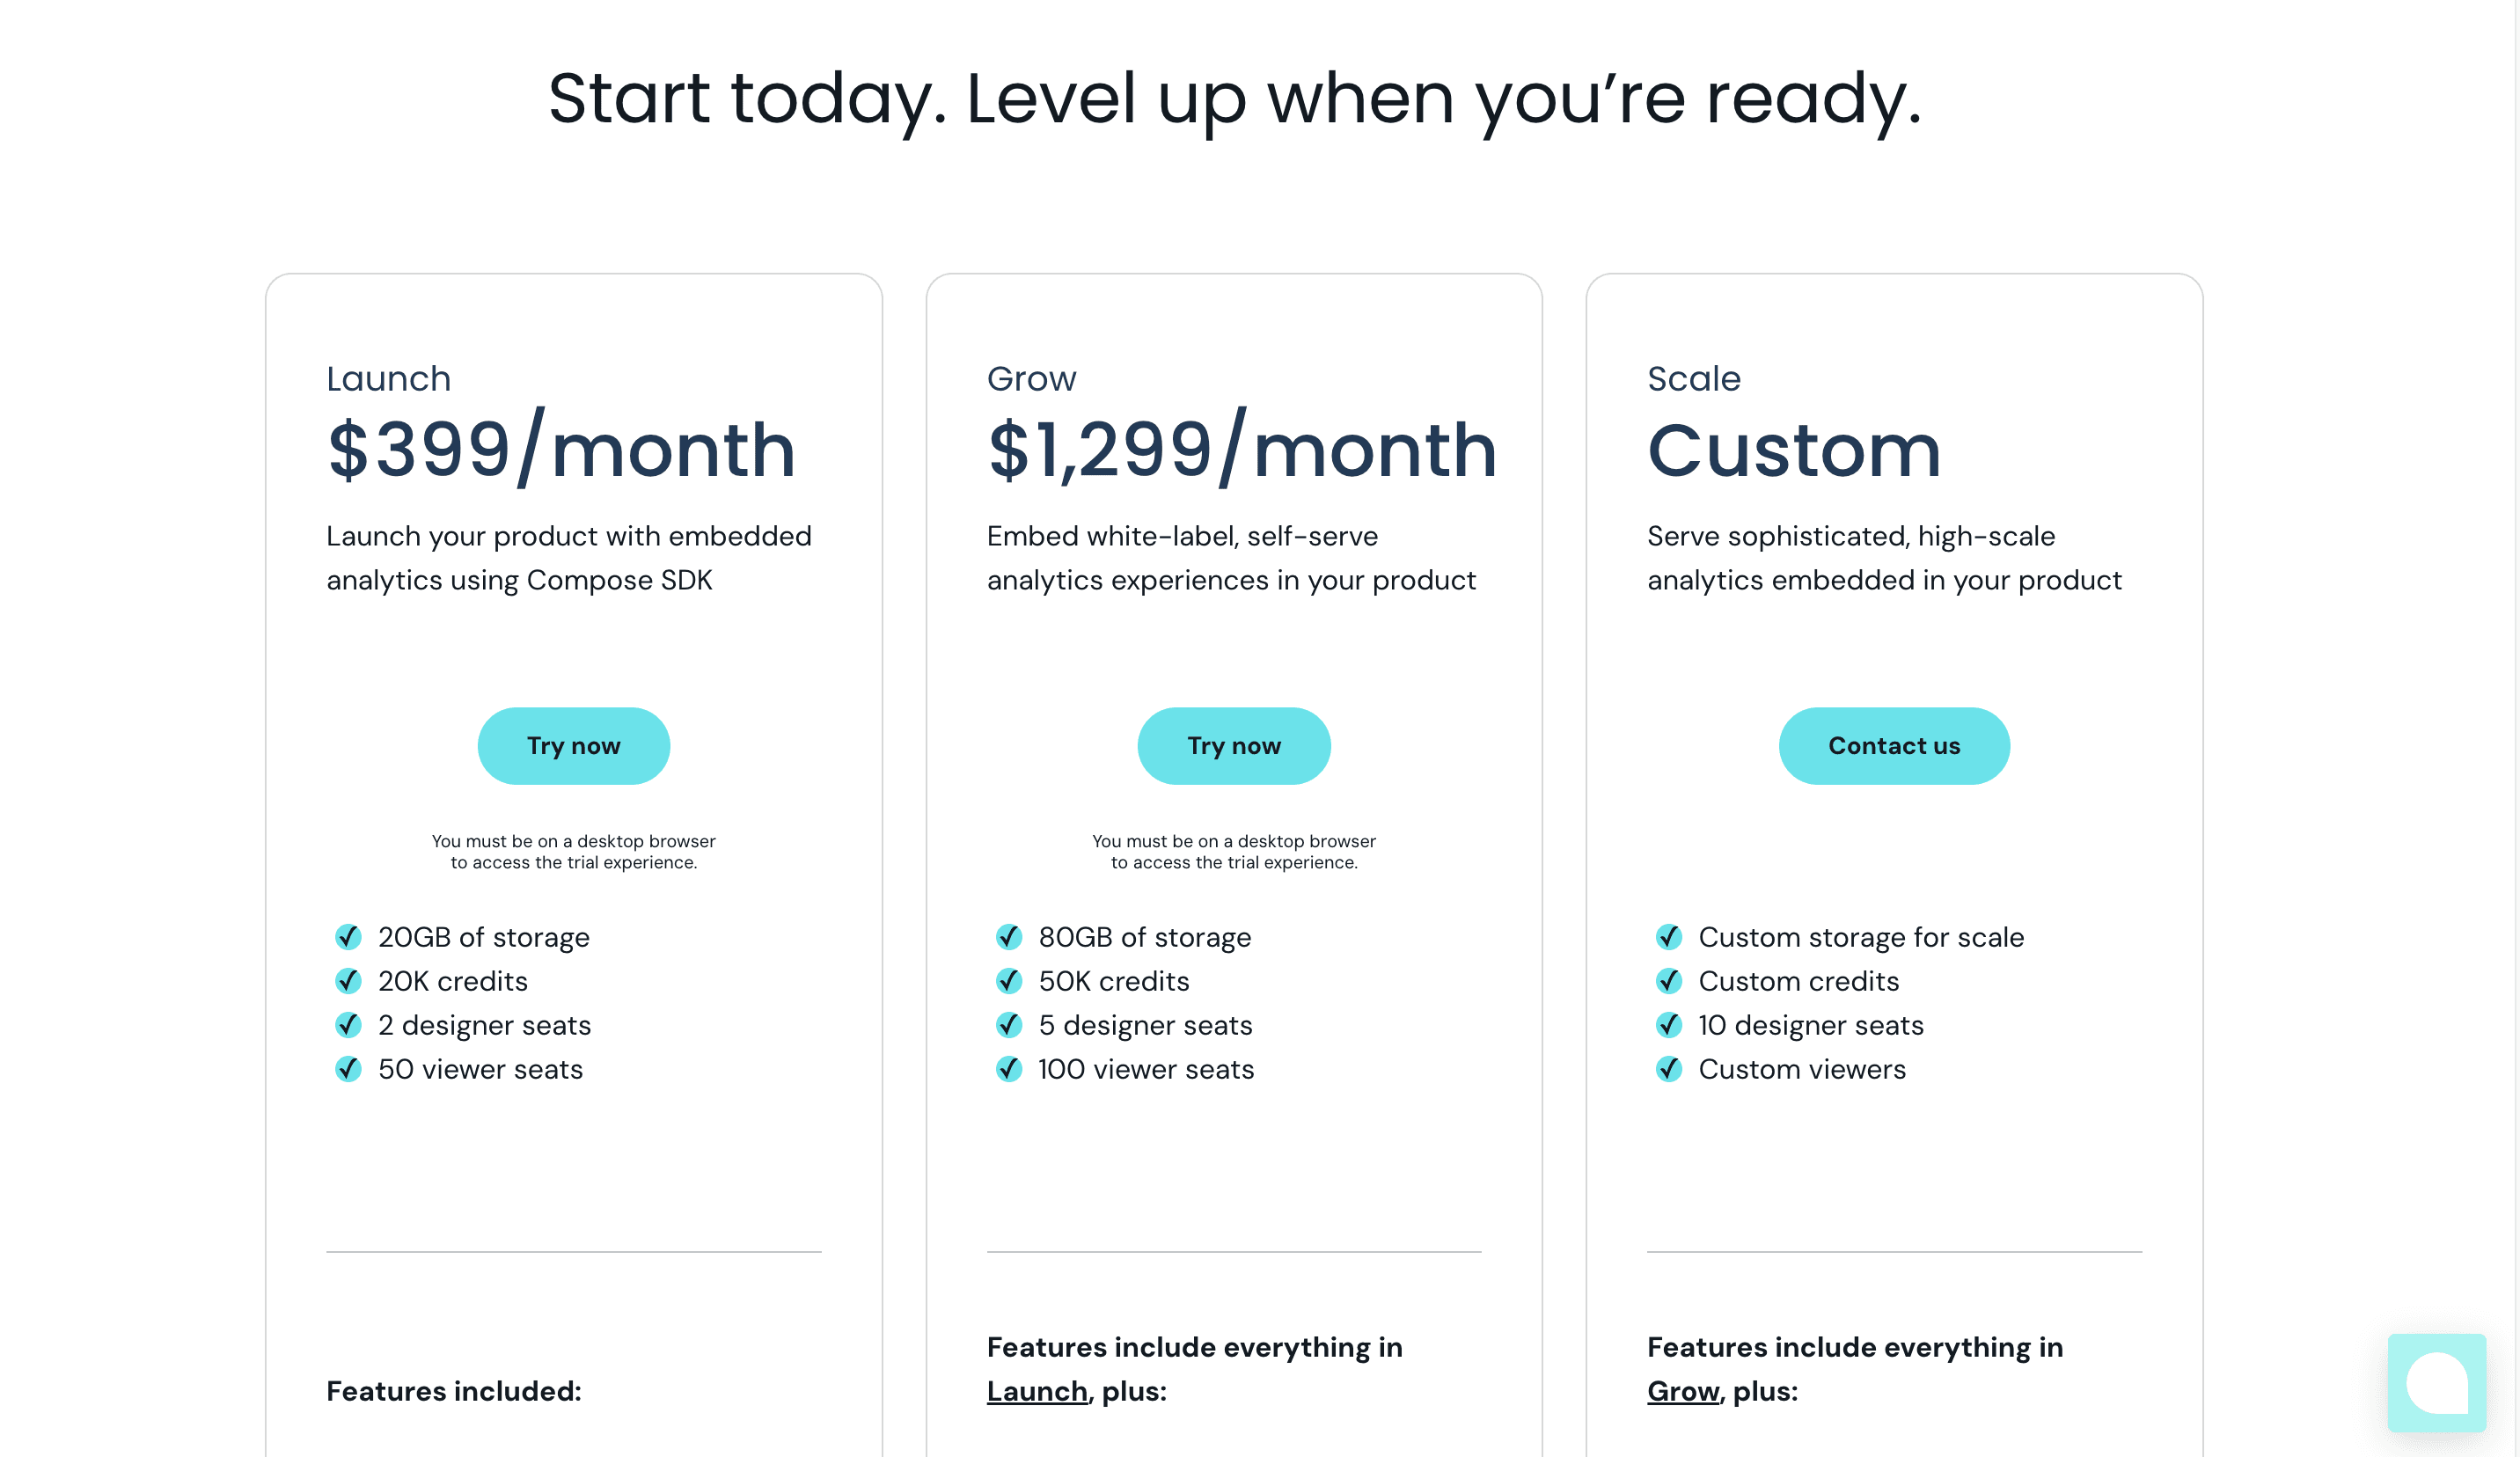
Launch: $399/month
Grow: $1,299/month
Larger deployments can require custom pricing
Ideal for
Software vendors, product teams, and enterprises that need embedded analytics, developer control, and AI-powered customer-facing data experiences.
3) Domo
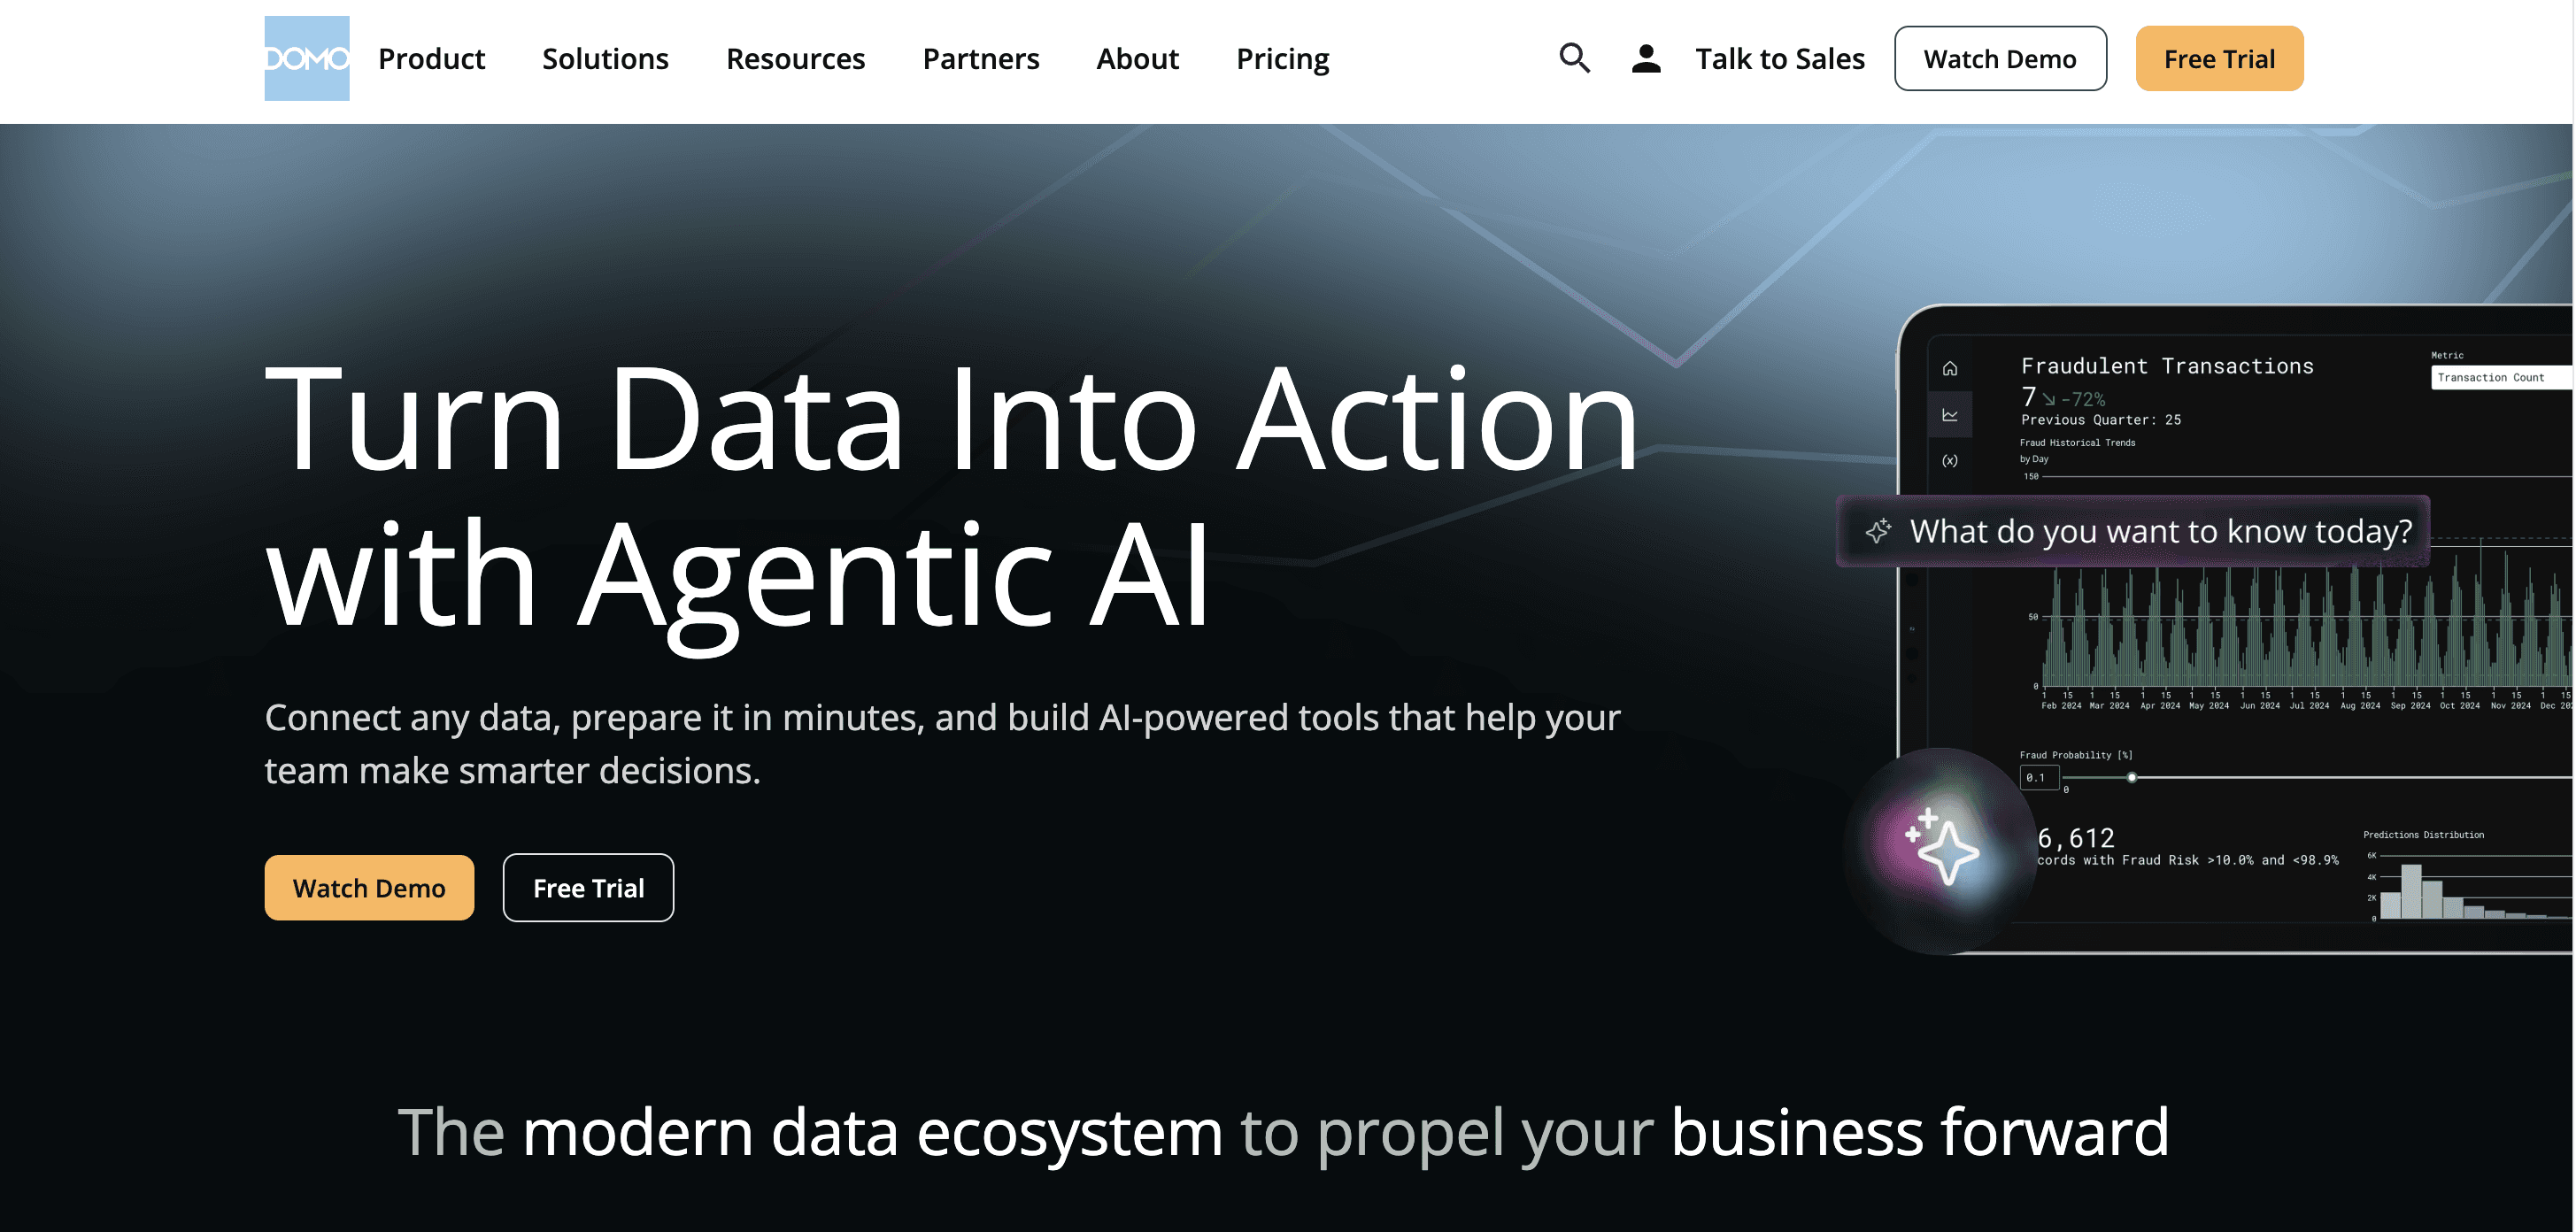
Domo is a cloud-based BI and data products platform built around real-time visibility, automation, and AI-powered workflows. In 2026, Domo is positioning itself as an AI and Data Products platform, not just a dashboard tool. That makes it attractive for organizations that want one system for data integration, reporting, AI chat, workflows, and operational analytics.
Top 5 features
Real-time dashboards and visibility: Helps teams monitor business performance continuously instead of waiting for static reports or delayed reporting cycles.
Conversational AI and AI chat: Supports natural conversations with data, making it easier for users to ask questions and explore answers quickly.
Data products platform: Goes beyond dashboards by helping teams prepare, distribute, automate, and operationalize data into reusable products.
Workflow and AI agent tasks: Domo’s AI features include agent tasks and workflow actions, which push BI closer to automation and guided decision-making.
Embedded AI experiences: Lets teams bring AI chat and analytics into content or workflows, which is useful for productized analytics and internal operations.
Limitations
Pricing is less transparent than simpler BI tools
Can become expensive for smaller teams
Best value often comes at broader organizational scale
Domo Pricing
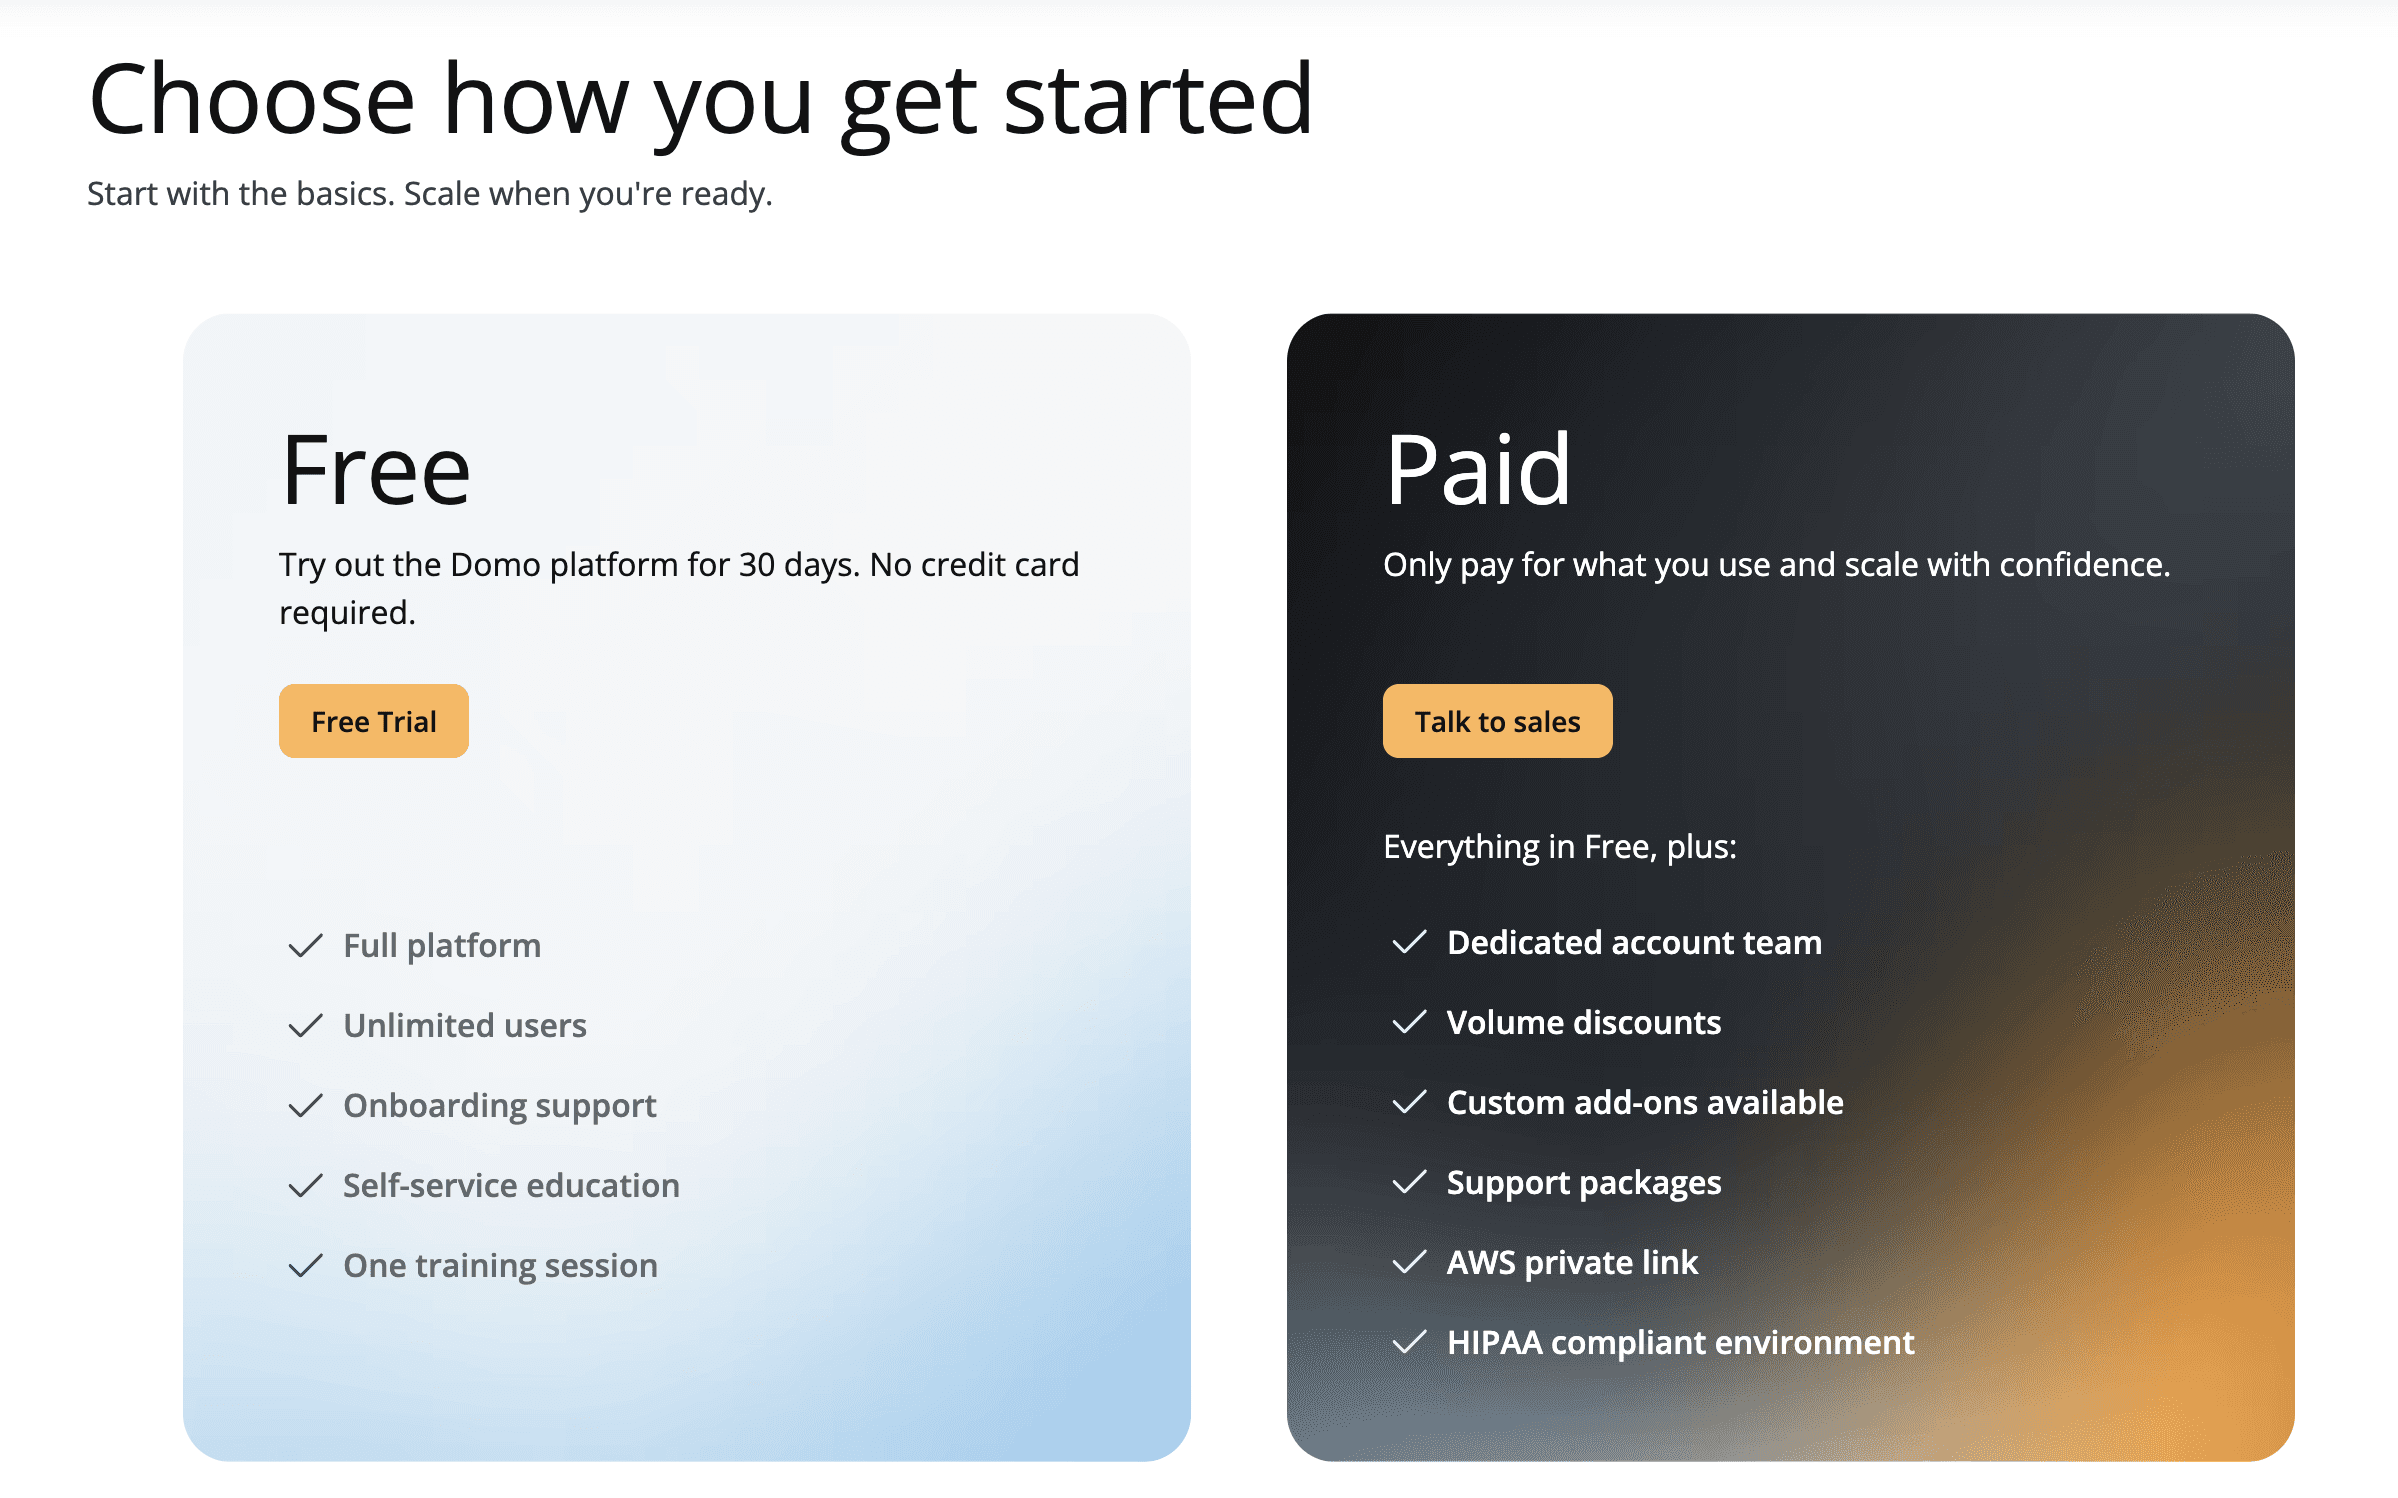
Official site highlights consumption-based pricing
Custom contracts are common rather than simple public seat pricing
Ideal for
Enterprises and data-driven teams that want cloud BI, AI, operational workflows, and real-time visibility in one platform.
4) Yellowfin BI
Yellowfin BI is an enterprise analytics platform known for embedded BI, dashboards, storytelling, and automated insights. Its positioning is especially strong for software vendors and product teams that want to embed analytics into applications without building everything from scratch. It also stands out for alerting and narrative-style analytics experiences.
Yellowfin BI Features
Embedded analytics: Makes it easier to add dashboards, analytics, and alerts directly into applications and customer-facing products.
AI-driven insights: Surfaces helpful insights and responses automatically, reducing the manual effort needed to discover changes in performance.
Automated alerts: Helps teams monitor metrics proactively instead of checking dashboards manually for every change.
Data storytelling: Supports narrative presentation of insights, which makes analytics easier to communicate to non-technical stakeholders.
Flexible usage-based pricing models: Its pricing options are designed to align with different embedded analytics business models rather than only fixed seat counts.
Limitations
Public pricing is not straightforward
Strongest fit is embedded and enterprise use cases
Less mindshare than some larger BI brands
Yellowfin BI Pricing
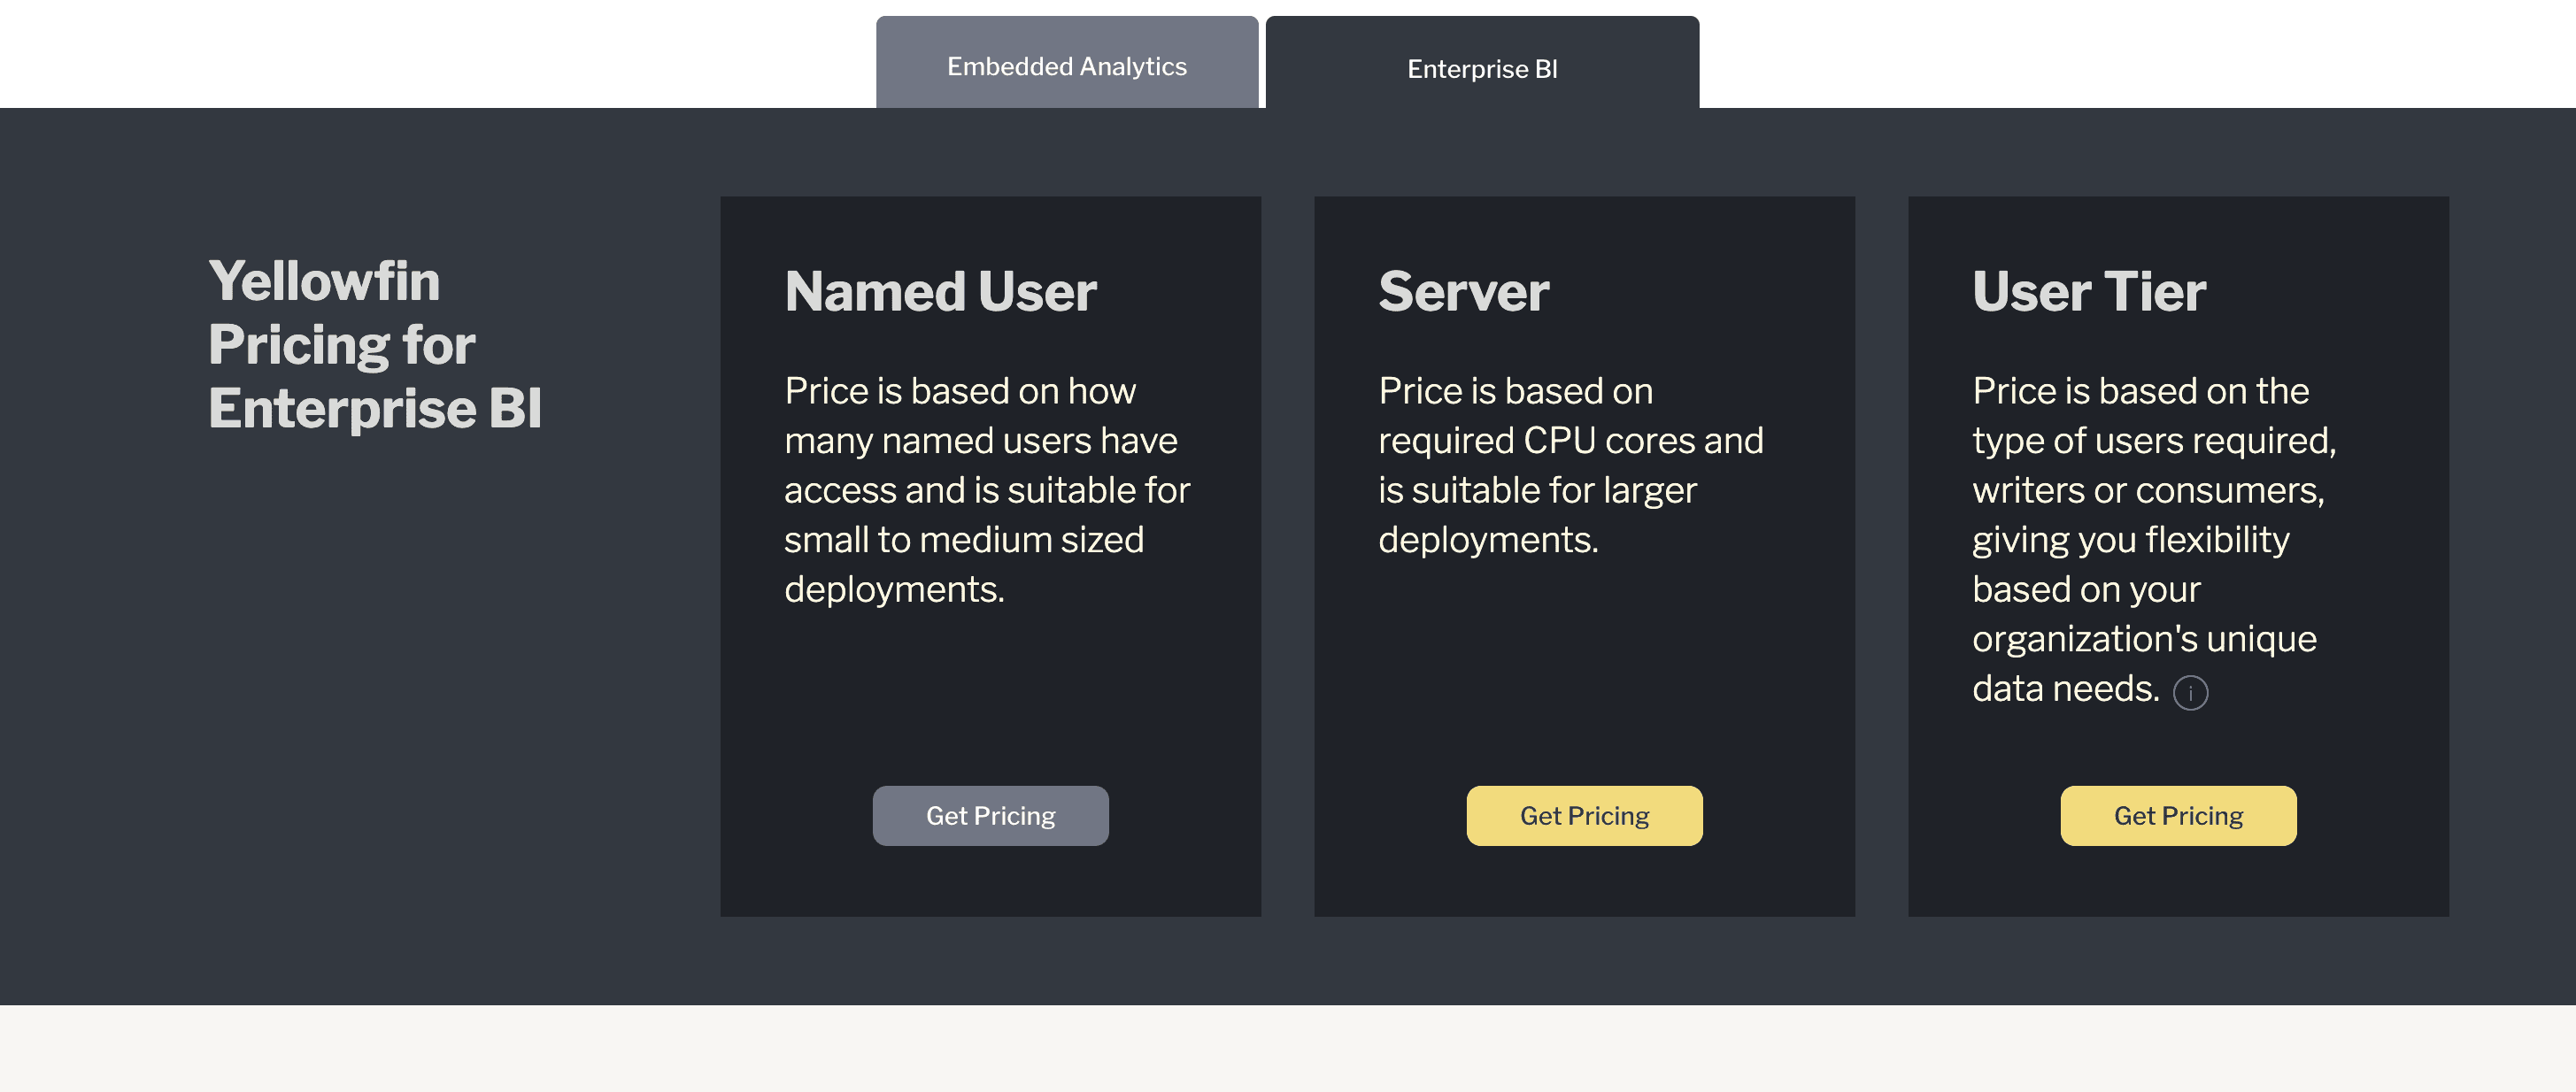
Custom pricing with usage-based and revenue-share options
Enterprise BI and embedded analytics plans available via quote
Ideal for
Software companies, enterprises, and product teams that want embedded BI, automated insights, and analytics experiences that are easier to present.
5) Holistics
Holistics is a SQL-first BI platform built around semantic modeling, governed reporting, and self-service analytics. It is especially attractive for teams that want a central semantic layer, reusable metrics, and more control over reporting logic. In 2026, it remains a strong option for modern teams that want reliability without moving fully into heavyweight enterprise BI.
Holistics features
Semantic-layer reporting: Lets teams define metrics and business logic centrally, which improves consistency across reports and dashboards.
SQL-first flexibility: Works well for teams that want more control over data modeling and reporting instead of relying only on drag-and-drop workflows.
Self-service analytics: Gives non-technical stakeholders easier access to trusted reports once the underlying models are set up properly.
Custom charts and curated datasets: Helps analysts shape how business users explore data, keeping reporting more guided and reliable.
Governance and admin features: Includes capabilities like Git version control, RBAC, and usage monitoring in higher plans for stronger control.
Limitations
Better for SQL-comfortable teams than fully non-technical teams
Some advanced reporting cases can still require extra work
Smaller brand presence than top legacy BI vendors
Holistics Pricing
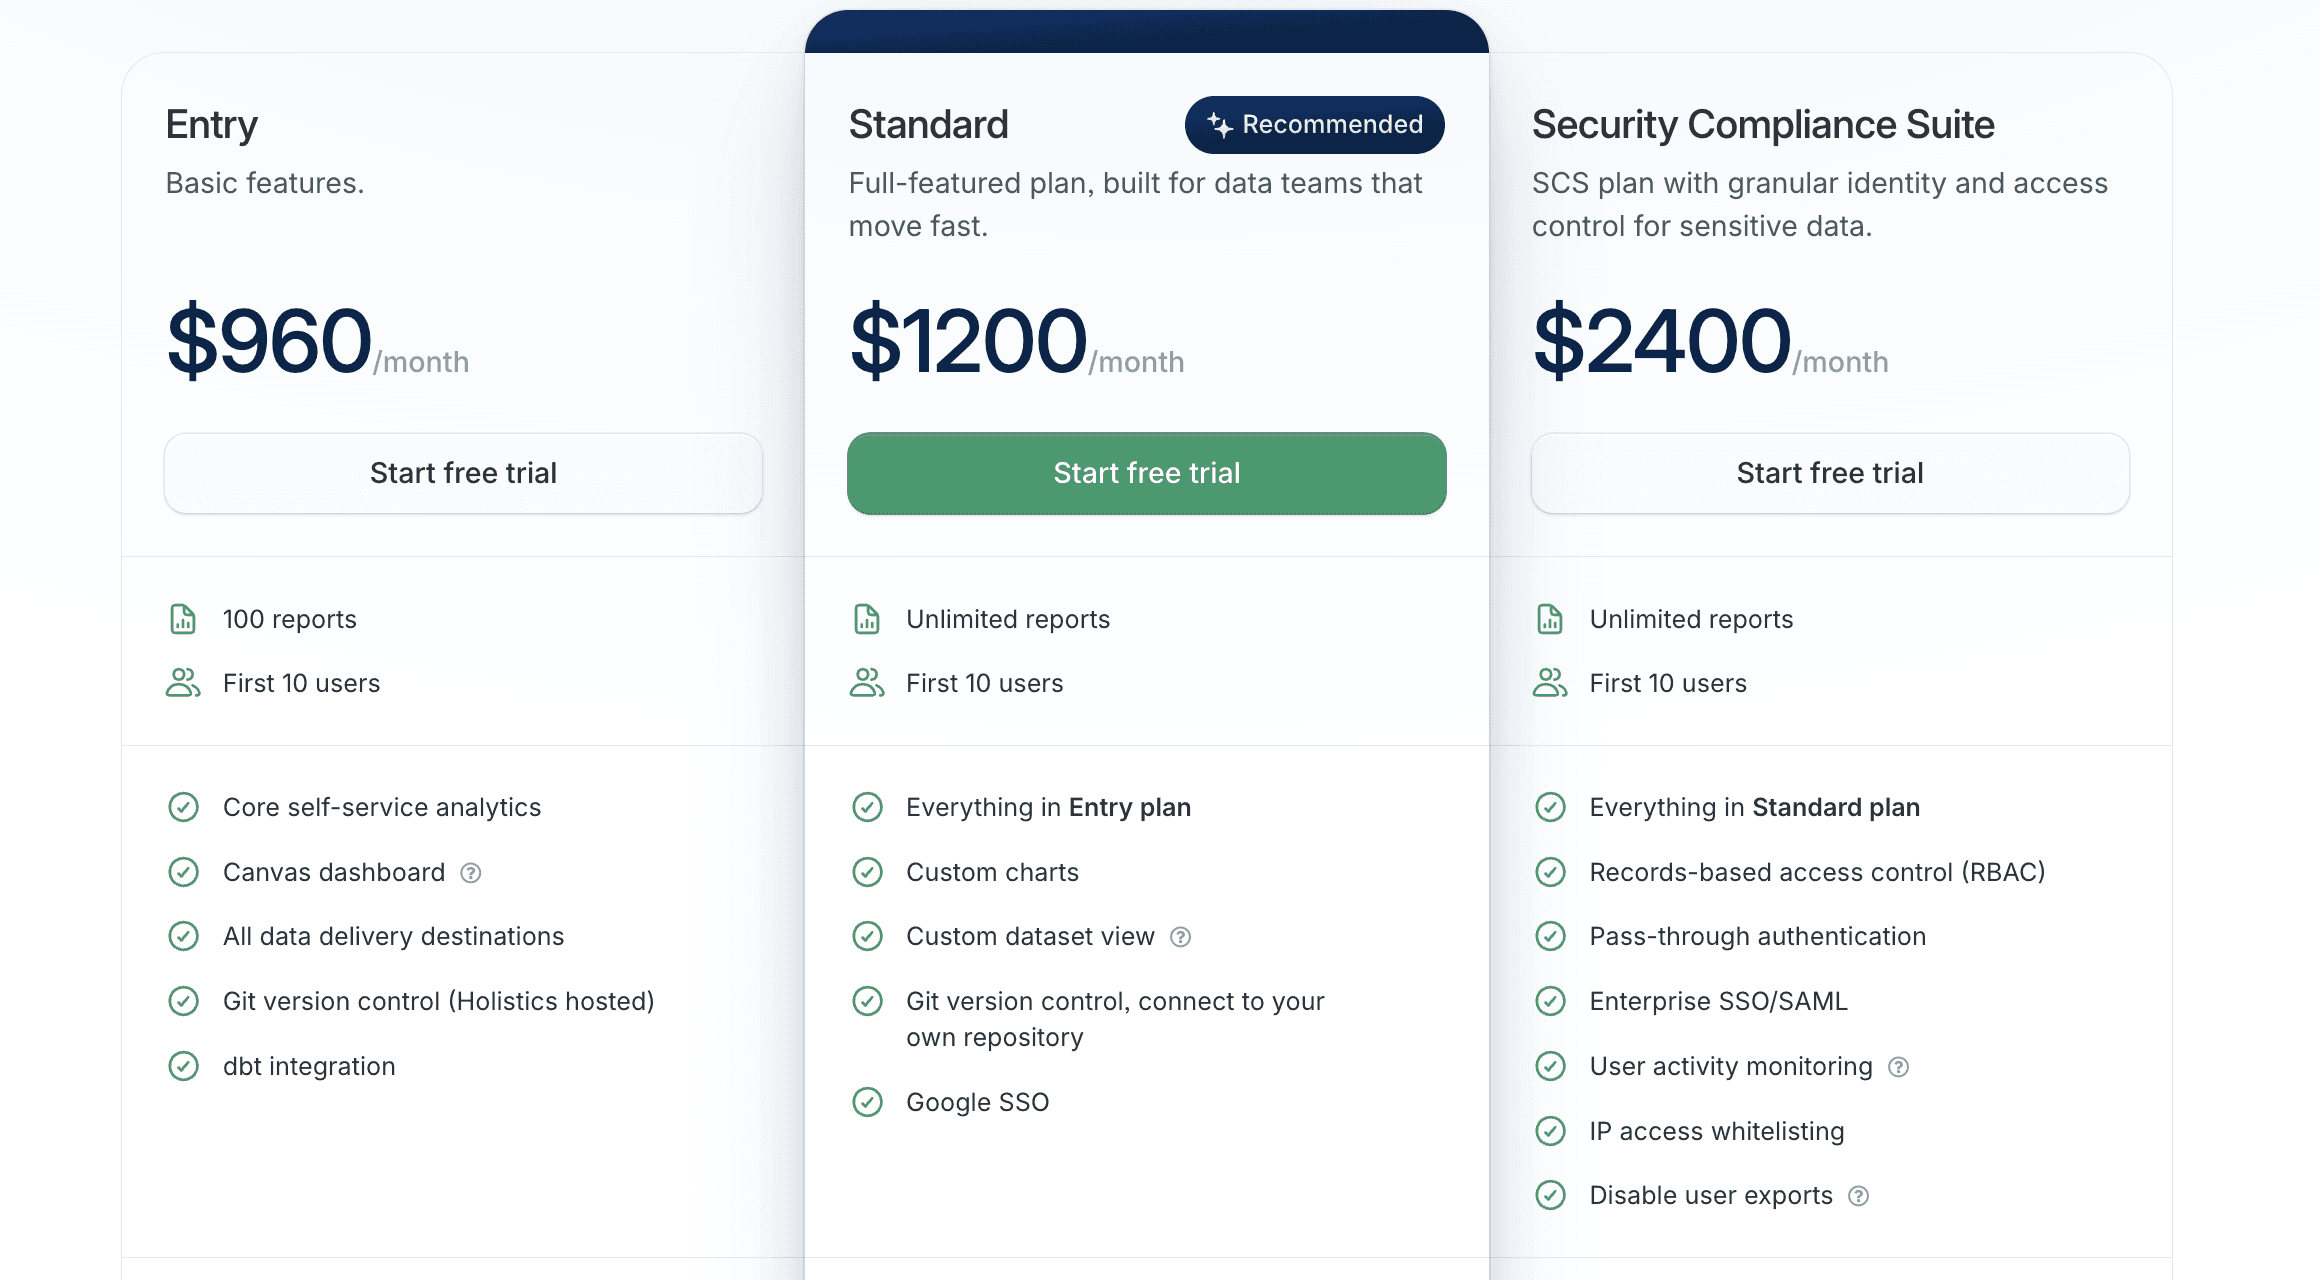
Entry: $120/month
Standard: $1,200/month
Higher security/compliance tiers available
Ideal for
Data teams and growing companies that want governed reporting, semantic consistency, and a SQL-friendly approach to self-service BI.
6) Hex
Hex is more than a classic BI tool. It is a collaborative analytics workspace that combines notebooks, SQL, Python, apps, and reporting in one product. That makes it especially useful for modern data teams that want flexibility, technical depth, and business-facing outputs together instead of splitting analysis across multiple tools.
Hex Features
Shared SQL and Python workspace: Lets analysts and data scientists work in one environment instead of jumping between separate notebook and BI tools.
Collaborative analytics apps: Supports reports and app-like outputs that make technical work easier to share with business teams.
AI assistance inside workflows: Brings AI into analysis and exploration, helping technical teams move faster through repetitive work.
Flexible technical analysis: Works well when teams need more than dashboards, such as experimentation, modeling, or deeper custom analysis.
Strong fit for modern data teams: Hex is especially useful when the same team needs notebooks, reporting, and collaboration in one place.
Limitations
Better suited to technical teams than general business-only audiences
Feels less like traditional BI
Best value comes when teams use its full collaborative workflow
Hex Pricing
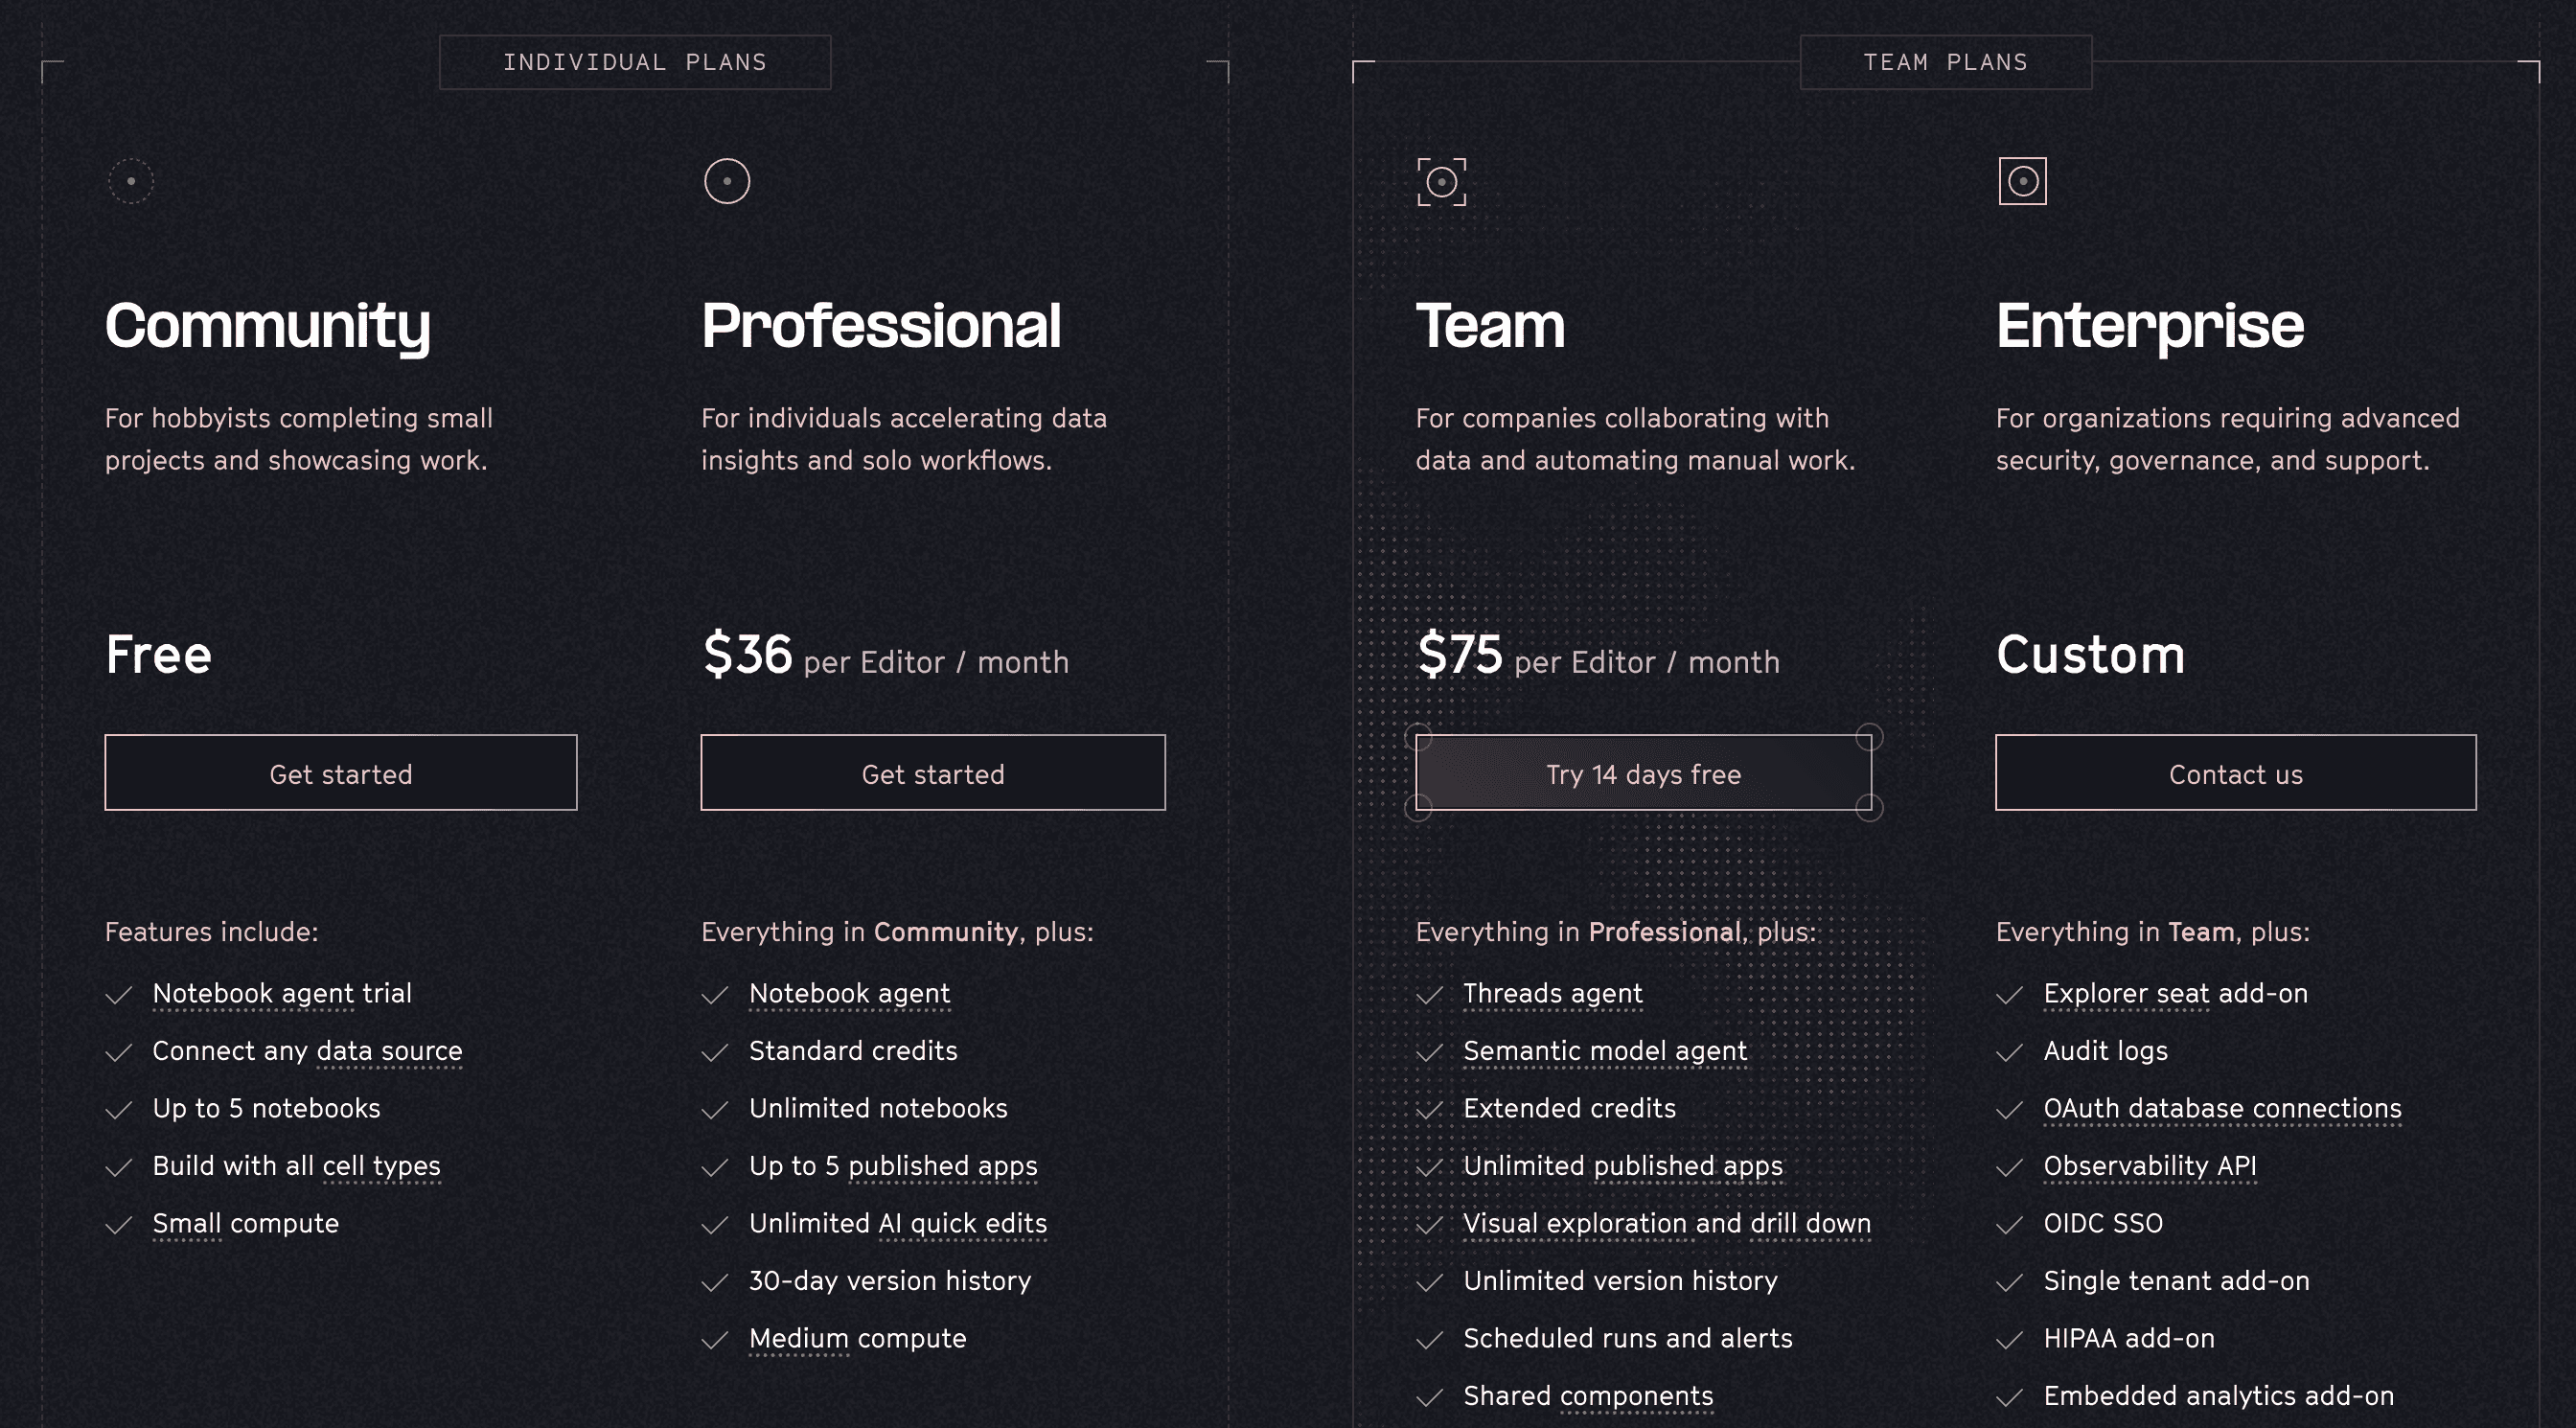
Pricing varies by plan and team size
Enterprise and team plans are sales-led; official pricing should be checked directly with Hex
Ideal for
Modern data teams that want SQL, Python, collaboration, AI assistance, and business-facing outputs in one workspace.
7) Lightdash
Lightdash is a modern BI platform designed for teams using dbt and warehouse-first analytics. Its biggest strength is semantic clarity: define trusted metrics once, then let teams explore them more easily. It fits organizations that want modern, governed BI without the overhead of older enterprise suites.
Lightdash Features
DBT-native workflow: Fits naturally into teams already using dbt, keeping analytics closer to the transformation layer and trusted models.
Semantic metric definitions: Helps teams define metrics once and reuse them consistently across dashboards and self-service analytics.
Natural language analytics: Makes data exploration easier for business users who do not want to work directly in SQL.
Modern self-service BI: Balances governance with easier exploration, so business teams can answer more questions independently.
Embedding and AI add-ons: Supports advanced use cases like embedding and AI-driven experiences for teams that need more than internal dashboards.
Limitations
Best fit for technical and dbt-centric teams
Stronger value when semantic models are already mature
Advanced AI capabilities may come as add-ons
Lightdash Pricing
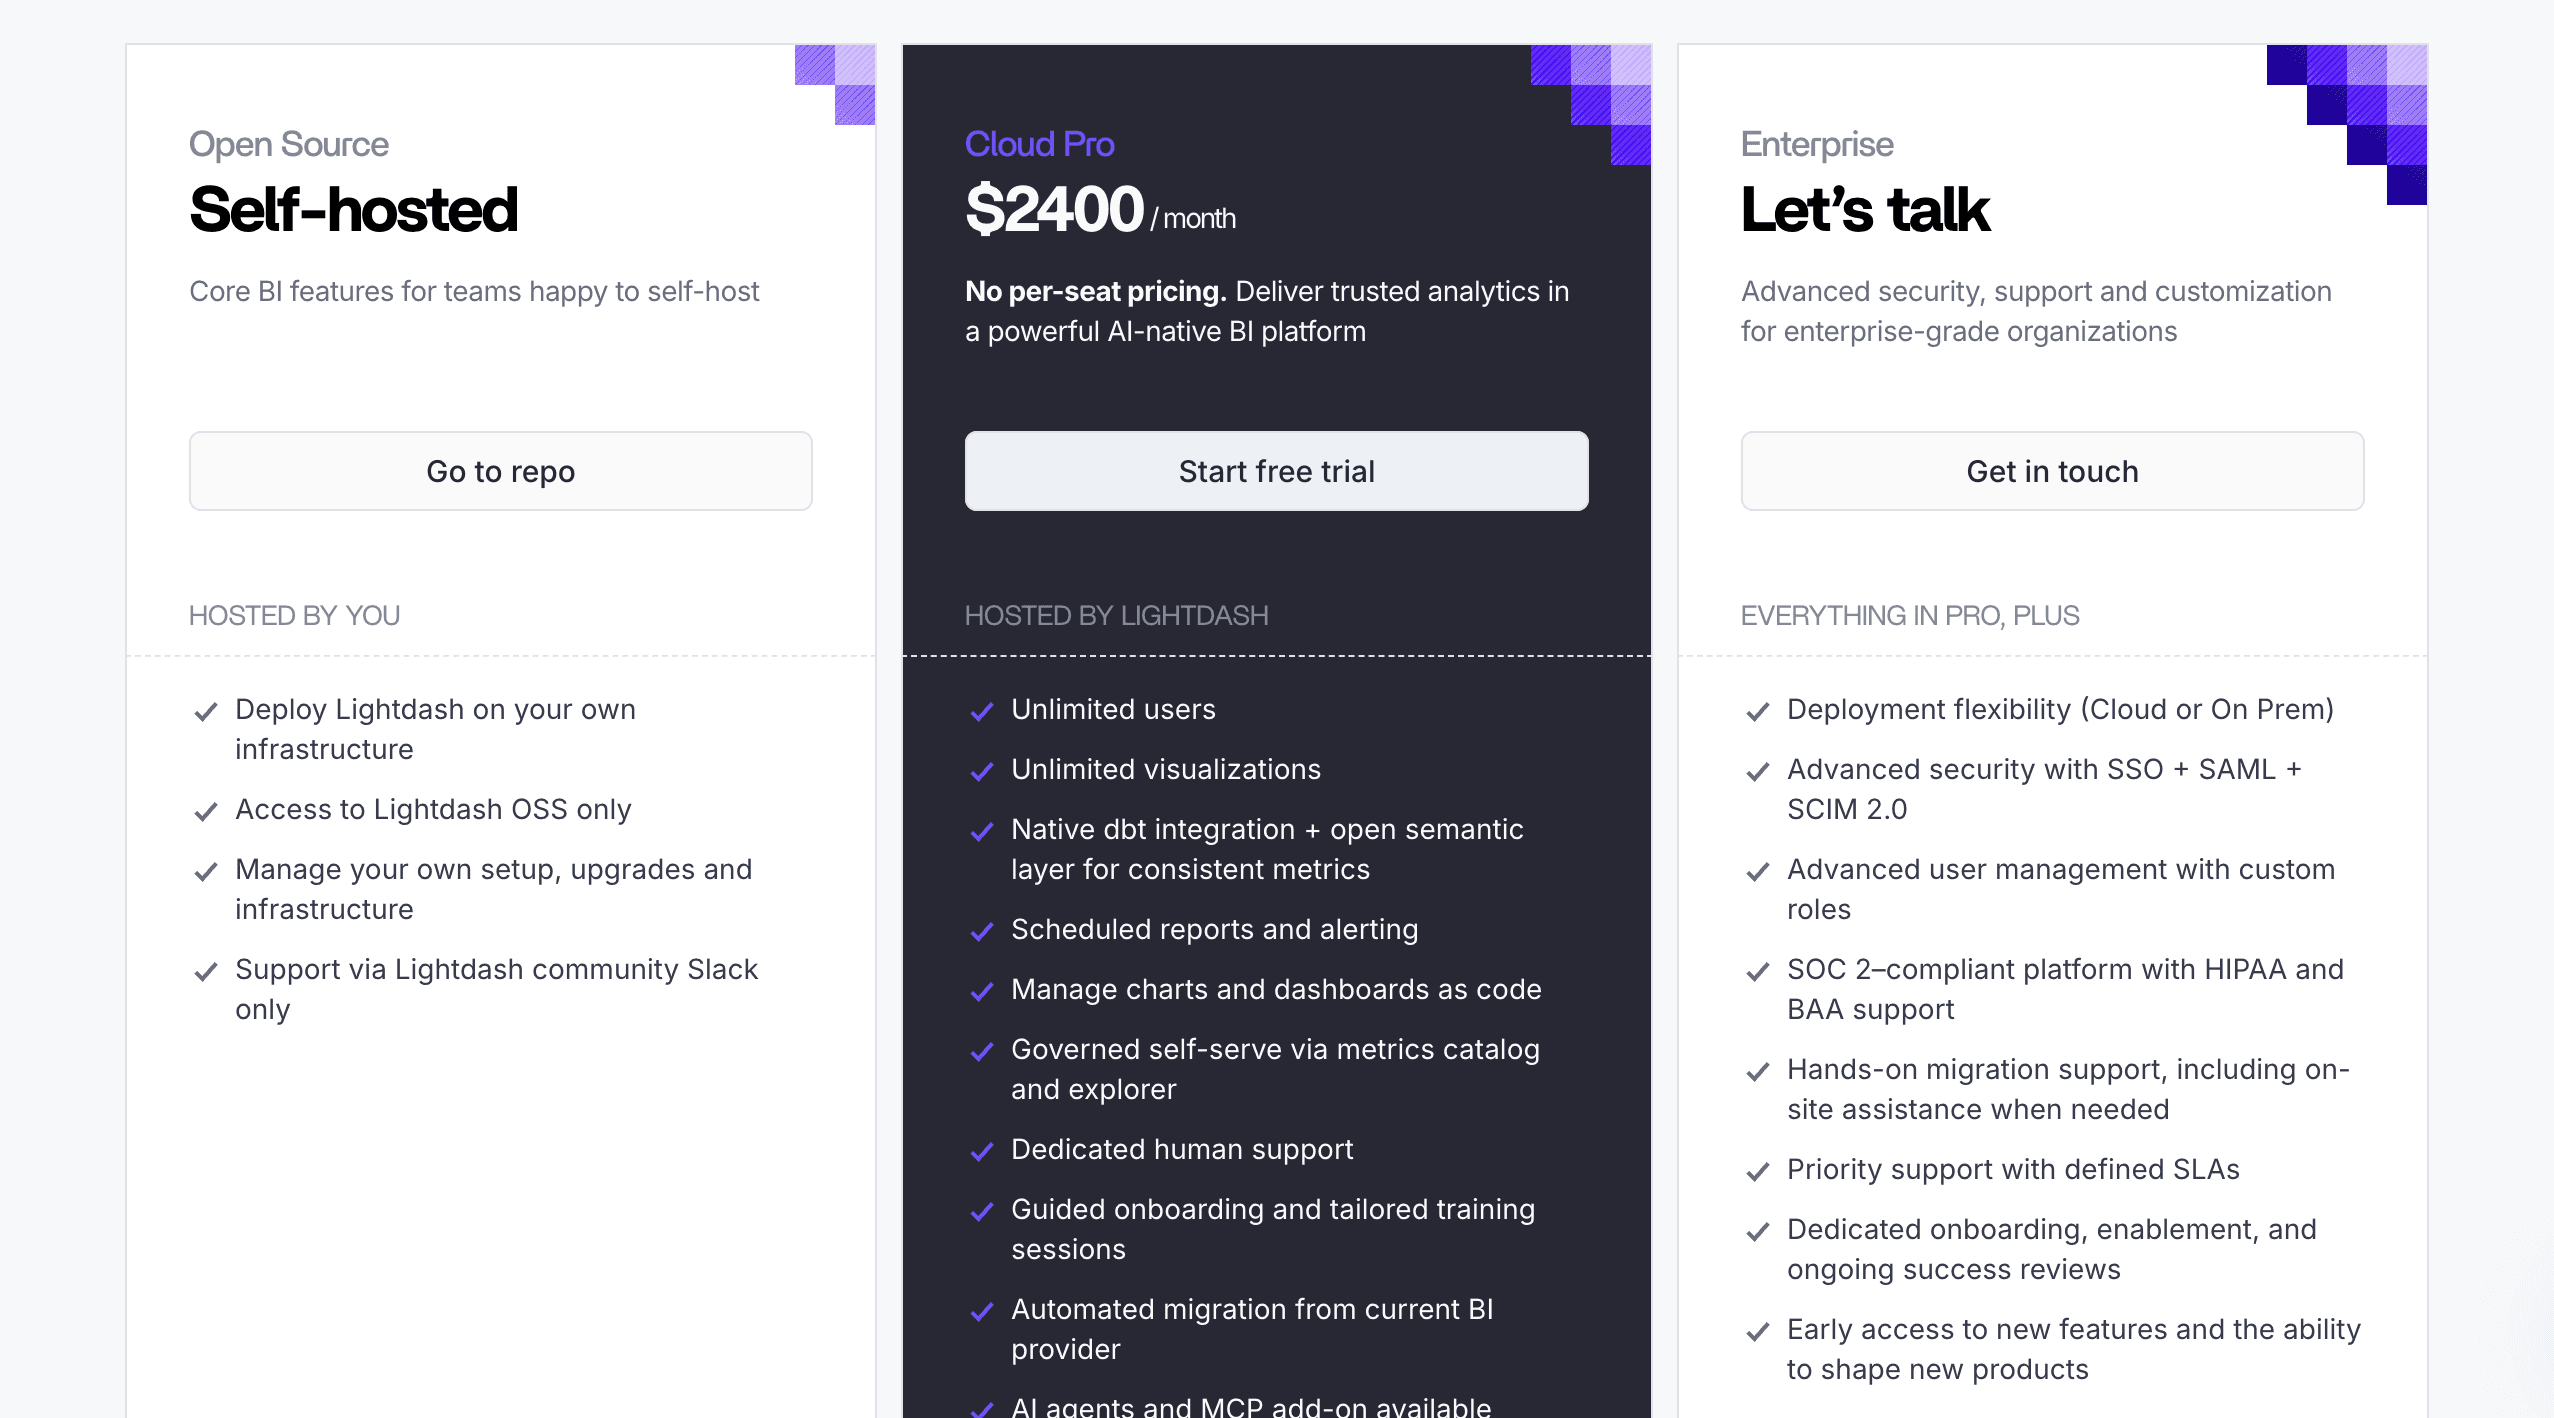
Varies by cloud, add-ons, and deployment model
Best checked directly with Lightdash for the latest plan details
Ideal for
dbt-centric teams and modern data organizations that want semantic-layer BI with more flexibility and cleaner governance.
Business Intelligence Tools
Tool | Best For | What It Does Best | Ease of Use | Pricing |
|---|---|---|---|---|
Supaboard | Teams looking for AI-assisted analytics and faster dashboard setup | Natural language analysis, dashboard creation, and multi-source reporting | Moderate to easy | Starts at $99/month |
Sisense | Product teams and companies focused on embedded analytics | Embedding dashboards into products, apps, and customer-facing workflows | Moderate | Starts at $399/month |
Domo | Enterprises and teams that need real-time business visibility | Real-time dashboards, cloud reporting, workflows, and operational analytics | Moderate | Custom / consumption-based |
Yellowfin BI | Companies that want embedded BI and automated insights | Embedded analytics, alerts, dashboards, and data storytelling | Moderate | Custom pricing |
Holistics | Data teams that want governed reporting and modeling control | Semantic-layer reporting, SQL-based analytics, and reusable metrics | Moderate | Starts at $120/month |
Hex | Modern data teams working across SQL, Python, and reporting | Collaborative analysis, notebooks, reporting, and technical workflows | Moderate | Starts at $75/editor/month |
Lightdash | dbt teams and warehouse-first analytics teams | Semantic metrics, self-service BI, and dbt-based workflows | Moderate | Custom / add-on based |
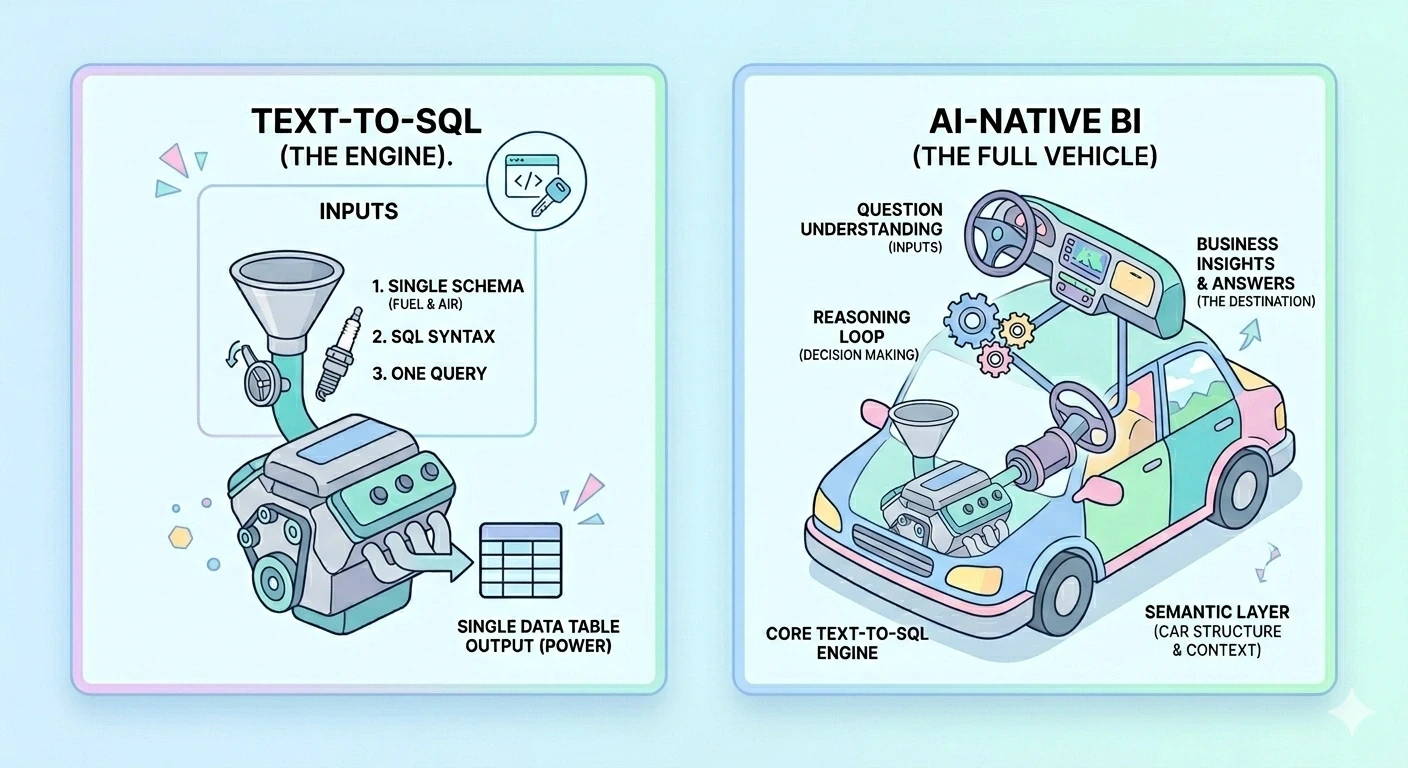
What “Agentic Analytics” Actually Means in Business Intelligence
Agentic analytics means BI tools do more than show dashboards or return one-off answers. Instead, AI can help monitor metrics, investigate changes, suggest follow-up questions, and sometimes trigger actions through workflows. ThoughtSpot popularized the term, but the broader idea is spreading across BI: analytics is shifting from passive reporting toward guided, goal-oriented decision support. That matters because teams no longer just want charts. They want systems that help explain what changed, why it changed, and what to do next.
Key points
Natural language becomes the starting point
AI helps with investigation, not just chart creation
Trusted metrics become more important
Tools can suggest next steps
BI moves closer to decision support than static reporting
Frequently Asked Questions
What is business intelligence and how does it work?
Business intelligence (BI) refers to the process of collecting, analyzing, and visualizing data to support better decision-making. It works by connecting data sources, transforming raw data into structured formats, and presenting insights through dashboards, reports, or queries that help teams understand performance and trends.
Why is business intelligence important for companies?
Business intelligence helps companies make data-driven decisions instead of relying on assumptions. It improves visibility into performance, identifies trends, and uncovers opportunities or risks. With BI, teams can respond faster to changes, optimize operations, and align strategies based on real insights rather than guesswork.
What are the main components of a BI system?
A typical BI system includes data sources, data integration tools, data warehouses, analytics engines, and visualization layers like dashboards. It may also include semantic models and AI features that help users query data easily. According to Microsoft, modern BI systems also integrate cloud infrastructure and AI to enhance data accessibility and decision-makin
What is the difference between business intelligence and business analytics?
Business intelligence focuses on descriptive insights like dashboards and reports, showing what happened. Business analytics goes further by using statistical models and predictions to explain why it happened and what might happen next. BI is often used by business users, while analytics may involve data specialists.
What are the benefits of using BI tools?
BI tools help organizations centralize data, improve reporting accuracy, and enable faster decision-making. They reduce manual work, increase transparency across teams, and allow users to explore data without deep technical skills. According to McKinsey & Company, companies that effectively use data and analytics are significantly more likely to outperform competitors in productivity and profitability.
What industries use business intelligence tools?
Business intelligence is used across many industries including finance, healthcare, retail, SaaS, manufacturing, and marketing. Any organization that relies on data to track performance, understand customers, or optimize operations can benefit from BI tools regardless of size or sector.
What is a dashboard in business intelligence?
A BI dashboard is a visual interface that displays key metrics and data insights in one place. It uses charts, graphs, and tables to help users quickly understand performance and trends. Dashboards are often interactive, allowing users to filter data and explore specific details.
What is a semantic layer in BI?
A semantic layer is a structured framework that defines business metrics and logic consistently across an organization. It ensures that terms like revenue, churn, or conversion rate mean the same everywhere. This improves data accuracy and trust, especially when multiple teams use the same BI system.
How do BI tools handle large amounts of data?
BI tools handle large datasets by using data warehouses, optimized queries, and caching mechanisms. They process and aggregate data efficiently to ensure fast performance. Modern BI platforms also integrate with cloud infrastructure, allowing them to scale and manage growing data volumes effectively.
What skills are needed to use BI tools?
Basic BI tools require minimal technical skills, especially those with drag-and-drop interfaces or natural language queries. However, advanced use cases may require knowledge of SQL, data modeling, or analytics concepts. According to Gartner, modern BI platforms are increasingly designed to support both technical and non-technical users through self-service and augmented analytics features.
Conclusion
The right Business intelligence tool is not about which tool is most popular, but which tool fits into your team’s workflow, data and budget. Each of the tools we reviewed has its strengths, whether it’s speed, flexibility of dashboards, AI capabilities, or ease of use. The best way to decide is to try them with your own data and real use cases. See what tool makes your team work faster , answer questions easier and collaborate better . Compare prices, performance and usability side by side. The right BI tool is one that delivers the most value and fits seamlessly with the way your team already works.
If your current BI setup feels slow or overly complex, it might be time to try a different approach. Supaboard lets you explore data through natural language and build dashboards quickly, start with a 14-day free trial and see how it works for your team.


