
Spend Analytics Technology: A Complete Guide to Tools, Use Cases & Best Practices (2026)
Spend analytics technology helps procurement teams cut costs by 10–20%. See how it works, compare top tools, and explore real-world use cases, including automated AI-driven spend analysis.


Your finance team has one number. Another acquisition. The CEO is eyeing a third of that. By the time someone has reconciled all three, the quarter is over and every decision in between was made on incomplete data.
This is not a data problem. That's a visibility problem. And how do you fix it? Spend analytics.
This guide covers what spend analytics really is, how it works, the 8 use cases that deliver the fastest ROI, and how to choose the right spend analytics software for your organization in 2026.
What is spend analytics? (definition + how it differs from spend analysis)
Spend analytics is the process of collecting, cleaning, categorizing and analyzing your organization’s spend data, so you know exactly where money is being spent across suppliers, departments, categories and time periods.
It answers three critical questions your expense tracker never will:
Why was this money spent?
Was it spent well?
What should change?
Without spend analytics, organizations often operate with limited visibility, resulting in duplicated vendors, uncontrolled maverick purchases, budget overruns, and reactive cost decisions based on incomplete information.
The difference from basic reporting:
Expense Tracking | Spend Analytics | |
|---|---|---|
Answers | What was spent | Why, how, and what next |
Output | A report | A decision |
Timing | Past | Past + predictive |
Users | Accounting | Finance, procurement, leadership |
Spend Analysis vs. Spend Analytics: Not the Same Thing
People often use these terms interchangeably. They shouldn’t.
Spend analysis is a one-off project. You pull the history, you clean it, you categorize it, and you get a point in time view of where money went. Think of it as a diagnostic test, a snapshot that helps you find quick savings opportunities and hidden issues in your spend.
Spend Analytics is a continuous capability, with tools, processes and people that continually monitor and analyze spend data over time. Think about the real-time monitoring system you build after the exam. It allows you to make proactive decisions on everyday basis.
Most organizations need both: a strong spend analysis to surface the biggest opportunities quickly, and a robust spend analytics capability to capture them systematically, track progress, and prevent the same problems from recurring.
What about automated spend analysis?
AI-powered platforms are increasingly transforming spend analysis by taking on the heavy lifting, extracting, cleaning, normalizing and categorizing data, that previously required weeks of manual effort.
Modern automated systems do this in hours instead of analysts spending days or even weeks preparing data before they can generate any meaningful insight. And the best thing? As these systems ingest more data from your organization, they consistently learn and improve over time.
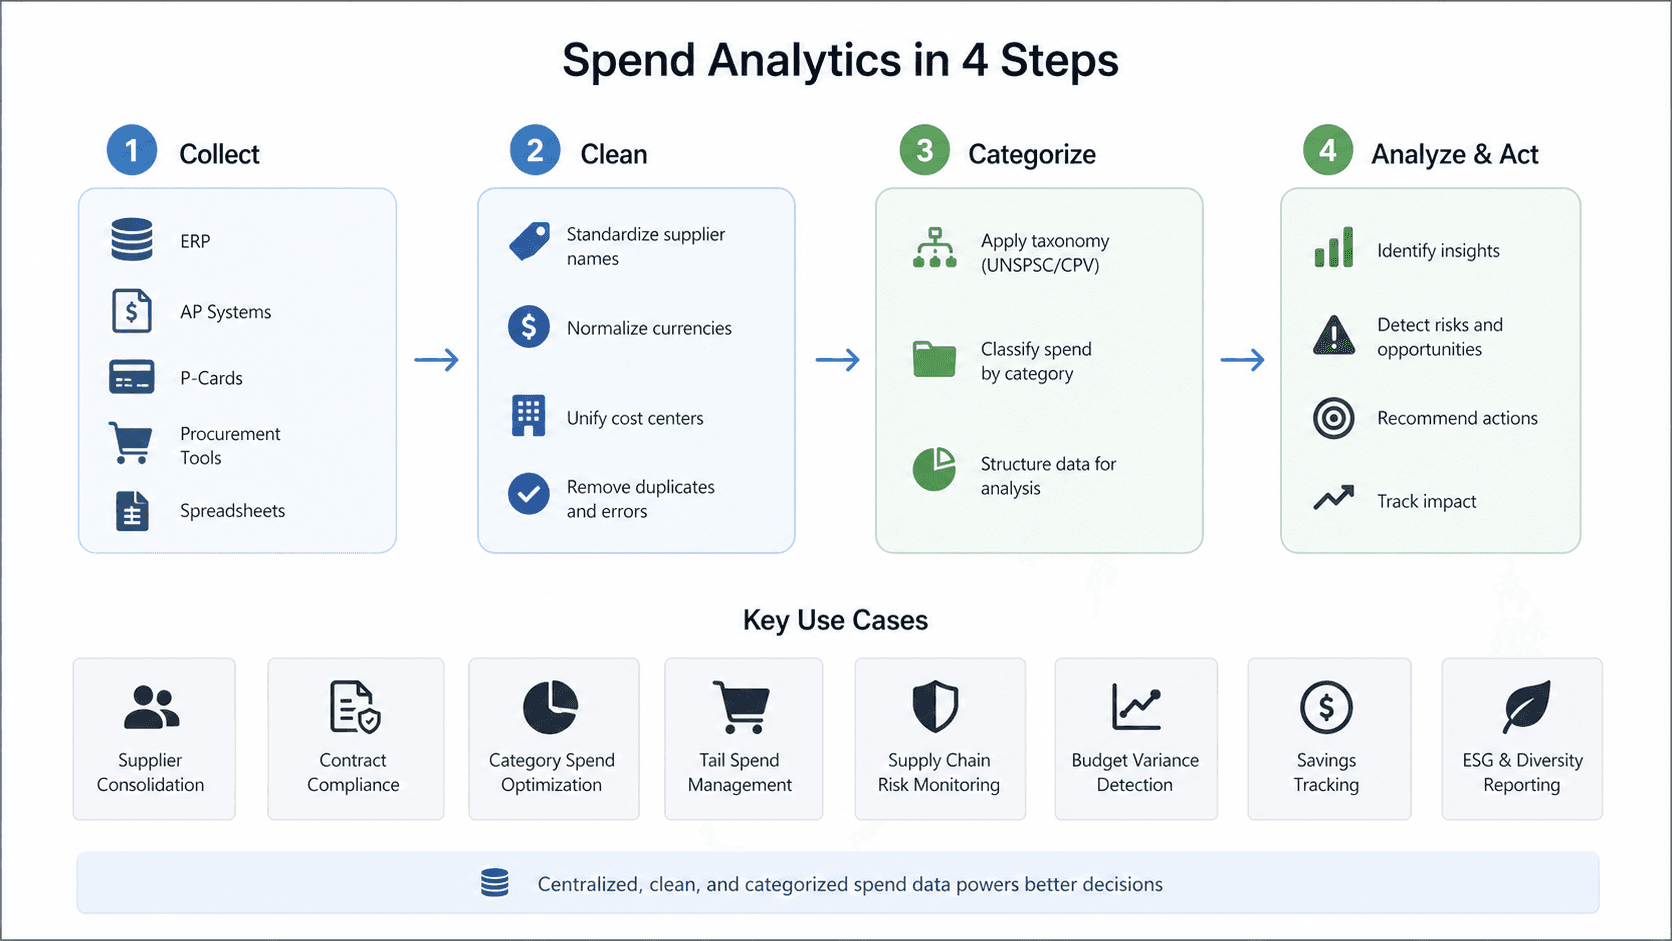
How Spend Analysis Works (The 4-Step Process)
Step 1: Collect
Spend data lives everywhere: ERPs, AP systems, procurement tools, purchase cards, and yes, spreadsheets. Step one is pulling it all into one place.
The technical challenge is manageable. The organizational challenge is harder, different systems use different supplier names, currencies, and cost center codes. Getting agreement on a unified data source is often the real work.
Step 2: Clean
Raw spend data is almost always a mess.
The same supplier shows up as "Acme Corp," "ACME Corporation," "Acme Corp Ltd," and "Acme" all referring to the same vendor. Amounts are in six currencies. Cost centers changed names mid-year.
Cleansing standardizes everything: one name per supplier, one currency for comparisons, consistent category codes. Skip this step and your totals are meaningless, you're literally comparing apples to motorcycles.
Modern spend analytics technology automates most of this via machine learning, flagging anomalies for human review rather than requiring analysts to manually reconcile every discrepancy.
Step 3: Categorize
Clean data needs structure. Classification assigns each spend record to a taxonomy, usually UNSPSC, CPV, or a custom internal hierarchy.
This is what makes real analysis possible. Without categorization, you can see total spend. With it, you can answer: "How much are we spending on cloud infrastructure across all departments?" or "Which categories have the most supplier concentration risk?"
Step 4: Analyze and Act
This is where the value lives. With clean, categorized data, common analyses include:
Tail spend analysis: finding the long tail of low-value, high-volume transactions that hide waste
Supplier concentration risk: flagging over-reliance on single vendors
Maverick spend detection: purchases made outside approved contracts
Category benchmarking: comparing your unit costs against market rates
Period-over-period trending: catching cost creep before it becomes a budget crisis
The best spend analytics platforms don't just show you what happened, they surface prioritized recommendations with context so your team can act, not just observe.
Why Spend Analytics Matters More Than Ever
Here's a stat worth noting: procurement typically represents 40 to 80 % of a company's total external cost, according to McKinsey. That's the single largest cost lever most organizations have, and most of them are managing it with incomplete data.
The same McKinsey analysis found that spend analytics isn't just a procurement tool anymore. During the COVID-19 crisis, organizations with spend visibility were able to model liquidity scenarios, identify supply risks, and act within days, while those without it were still trying to figure out what they were buying and from whom.
McKinsey's research on procurement resilience found that a North American industrial company used a digital spend analytics solution to uncover sources of cash, model P&L scenarios across recovery options, and identify risky suppliers, all simultaneously. That's not a procurement win. That's a business survival capability.
8 Real-World Spend Analytics Use Cases
1. Supplier Consolidation
Most mid-size organizations have far more suppliers than they need.
It's common to find 12 different MRO vendors covering the same categories as the top two, often at worse prices, with more administrative overhead, and less negotiating leverage.
Spend analytics makes consolidation actionable by showing:
Total spend per supplier by category
Overlap between vendors covering identical goods or services
Volume leverage if spend were consolidated
The result isn't just a cleaner vendor list. It's negotiating power.
2. Contract Compliance and Maverick Spend
Your procurement team negotiates preferred supplier contracts at agreed rates. Then employees buy the same things from non-contracted vendors, because it's faster, or they don't know the contract exists.
This is maverick spend. It's expensive and almost entirely invisible without spend analytics.
Spend analytics quantifies it by cross-referencing purchases against contracted supplier lists, flagging out-of-policy transactions by department and buyer, and calculating the cost of non-compliance in dollars, not percentages.
Once you can see it precisely, you can fix it.
3. Category Spend Optimization
Every spend category has different levers for cost reduction:
IT software → license audit and tool consolidation
Logistics → lane optimization and carrier renegotiation
Professional services → rate card standardization
The problem is most category managers negotiate with gut instinct rather than data. Spend analytics changes that.
Instead of asking a supplier for a 5% discount because "we're a loyal customer," you can show them exactly how much you spent with them versus their competitors last year, your projected volume, and what alternative suppliers have quoted.
That's a very different negotiation.
4. Tail Spend Management
Tail spend, the bottom 80% of transactions by value, typically represents only 20% of total spend but consumes a disproportionate share of procurement resources to manage.
These small, frequent, low-value purchases are hard to control and easy to ignore. They add up.
Tail spend analytics identifies:
Which categories dominate your transaction volume
Which can be moved to procurement cards or punch-out catalogs
Where consolidation is possible without sacrificing quality or service
5. Supply Chain Risk Monitoring
When supply chains collapsed in 2020, the organizations that recovered fastest shared one trait: they knew exactly where their supplier concentration risk was.
They could see which categories had single-source dependencies. They had data to act on, not assumptions.
McKinsey documented how a European industrial company used spend analytics integrated with a supplier risk module to map tier 1 and tier 2 supplier risks, flagging hotspots by potential impact size, then developing alternative supply sources based on actual risk scoring rather than guesswork.
Supplier spend analysis of this type has moved from "nice to have" to table stakes for any organization with meaningful supply chain complexity.
6. Budget Variance Detection
Traditional budget-versus-actual reports tell you that you overspent. They don't tell you why, and they rarely tell you early enough to intervene.
Spend analytics adds the missing dimension: when a budget line is trending over, you drill into the category, department, and transaction set to find the root cause.
Is it a contract price increase you didn't know about? A new project driving demand? A department buying outside policy? The answer is in the data, spend analytics makes it visible in minutes, not weeks.
7. Procurement Savings Tracking
"Savings" is notoriously slippery to measure without a structured approach. Savings from what baseline? Last year's price? The first quote? The budgeted amount?
Without consistency, every savings claim is suspect, and leadership stops trusting procurement's numbers.
Spend analytics provides a consistent framework: a baseline price, a negotiated price, and actuals. This creates accountability for claimed savings, makes procurement's impact visible, and helps leadership understand what initiatives are actually delivering.
8. ESG and Diversity Spend Reporting
Organizations are increasingly required, or choosing, to report on supplier diversity, sustainability, and ethical sourcing.
What percentage of spend goes to minority-owned businesses? Which suppliers meet specific environmental standards? Where in the world is our supply chain, and what's its carbon footprint?
McKinsey's Spendscape platform specifically highlights carbon and sustainability analytics as a core capability, combining spend data with carbon emission factors to enable Scope 3 emissions reporting. That's how seriously this is being taken at the enterprise level.
Without spend analytics infrastructure, this reporting is a quarterly scramble. With it, it's an automated report.
To understand how spend analytics fits into the broader analytics landscape, read Types of Analytics Explained: Descriptive, Diagnostic, Predictive & Prescriptive.
Top spend analytics tools and software in 2026 (comparison table, targets tools/software queries)
Different organizations need different capabilities depending on size, data complexity, and existing systems. Here’s a straightforward breakdown:
SAP Ariba
A widely used procurement and spend management platform that includes analytics alongside sourcing, supplier management, and contract workflows. Strong integration with SAP ERP systems.
Best for: Organizations already using SAP.
Coupa
A full spend management platform covering procurement, invoicing, expenses, and analytics. Analytics is built into broader procurement workflows.
Best for: Companies looking for an all-in-one procurement system.
McKinsey Spendscape
An enterprise-focused spend analytics solution with strengths in data classification, supplier insights, and sustainability analytics.
Best for: Large enterprises with complex procurement environments.
Sievo
A dedicated spend analytics platform focused on classification, savings tracking, and supplier analysis.
Best for: Organizations with mature procurement functions.
What to Evaluate When Choosing Spend Analytics Software
Criteria | What to Ask |
|---|---|
Data connectors | Does it integrate with your existing systems easily? |
Classification accuracy | How much manual correction is needed? |
Time to value | How quickly can you get usable insights? |
User accessibility | Can non-technical users access and explore data? |
Savings tracking | Does it support structured savings measurement? |
What a Spend Analytics Dashboard Actually Shows
A spend analytics dashboard isn't one screen. It's a set of layered views, each built for a different audience.
Executive view: Total spend trend, top 10 suppliers by spend, savings YTD, budget variance summary. Designed for 60-second consumption.
Category manager view: Spend by category vs. prior period, supplier mix, contract coverage percentage, maverick spend rate, savings pipeline.
Finance view: Budget vs. actual by cost center, period-over-period variance, AP aging by supplier, accrual visibility.
Procurement operations view: PO compliance rate, invoice matching exceptions, tail spend transaction volume, approval bottlenecks.
The critical feature: drill-down from any summary metric to the underlying transactions. When the CFO asks "why is facilities spend 12% over budget?", the category manager can show exactly which transactions, from which suppliers, drove the variance, in under two minutes.
Spend Analytics Outsourcing vs. Building In-House
One of the most common decisions: do you build internally or partner with external spend analytics services providers?
Outsourcing makes sense when:
You're doing a one-time spend analysis project, not building an ongoing capability
You lack internal data engineering resources
You need rapid stand-up (e.g., before a major procurement review or transformation)
Your spend data is particularly fragmented across legacy systems
Spend analytics consulting firms typically bring proprietary classification engines and market benchmarks, adding external context your internal team can't build alone.
Building in-house makes sense when:
You need continuous, real-time spend visibility rather than periodic reports
Procurement and finance teams need to self-serve analytics without waiting on external delivery
Your spend data is relatively accessible from existing systems
You're building or have internal data capabilities
The middle path
Modern AI-powered spend analytics platforms have largely eliminated this trade-off.
Tools like Supaboard connect directly to your data sources, automate classification and analysis, and give business users direct access, without requiring a data engineering team to build and maintain everything. You get the real-time, self-serve benefits of building in-house without the infrastructure investment.
Common Challenges (and How to Solve Them)
Data quality issues
Spend data is almost always messier than expected. Use ML-powered cleansing tools for bulk normalization, and establish a governance process that prevents new inconsistencies from being introduced.
Organizational resistance
Teams built around spreadsheets resist new workflows. Start with a use case that delivers obvious value to a skeptical team. Early wins build credibility and create internal advocates.
Proving ROI before you start
You don't know what you'll find until you look. The practical answer: start with a scoped spend analysis project to identify and quantify the opportunity. Use those findings to build the business case for the ongoing capability. Most organizations find the first spend analysis pays for a full year of the analytics platform.
Frequently Asked Questions
What are the common use cases for spend intelligence platforms?
The most valuable use cases include supplier consolidation, contract compliance monitoring, maverick spend detection, tail spend management, category cost optimization, supply chain risk monitoring, savings tracking, and ESG/diversity spend reporting. Among these, supplier consolidation and contract compliance typically deliver the fastest and most measurable ROI, often within the first 90 days.
What's the difference between spend analysis and spend analytics?
Spend analysis is a specific, often one-time examination of historical spend data. Spend analytics is the broader, ongoing capability that continuously monitors and analyzes spend over time. Think of spend analysis as a diagnostic exam and spend analytics as the monitoring system you build afterward.
What is automated spend analysis?
Automated spend analysis uses machine learning to handle data extraction, cleaning, supplier normalization, and category classification. It replaces weeks of manual work with just hours of automated processing. The system also improves accuracy over time as it learns from corrections and new data.
How does spend analytics improve strategic decision-making?
It replaces partial data and assumptions with structured evidence. With reliable spend visibility, procurement teams can negotiate using actual volumes and historical pricing, quantify the real cost of non-compliance, identify categories with the highest savings potential, and better align sourcing strategy with business priorities. This creates a shift from asking “what did we spend?” to “what should we spend, with whom, and on what terms?”
What is spend analytics outsourcing?
Spend analytics outsourcing means partnering with an external provider, such as a consulting firm or managed services company, to manage data collection, cleaning, classification, and analysis. Organizations typically choose to outsource when they need rapid setup, lack internal data expertise, or are running a one-time project instead of building an in-house function.
How long does spend analytics implementation take?
Implementation time varies by tool. Traditional enterprise platforms like Coupa and SAP Ariba often require 6 to 18 months due to complex integrations and configuration. In contrast, modern AI-powered platforms like Supaboard can connect to your existing data sources and deliver initial insights in days or weeks.
What is a spend analytics dashboard?
A spend analytics dashboard is a visual interface that displays key spend metrics, trends, and insights in real time. The best dashboards are layered, offering executive summaries, category-level views, and finance perspectives, with the ability to drill down from any metric to underlying transactions. AI-powered platforms further enhance this by making dashboards conversational, allowing users to ask questions in natural language instead of navigating pre-built charts.
The Bottom Line
Every organization has spend data. Most organizations do not truly understand what it is telling them.
The gap between simply having data and truly understanding it is exactly where spend analytics delivers value. Organizations that close this gap consistently outperform others through better cost efficiency, stronger supplier performance, and greater ability to respond effectively when market conditions change.
The good news is that you do not need a lengthy 12-month transformation project to begin. A focused spend analysis can uncover meaningful opportunities in just weeks. Modern AI-powered platforms now make it possible to move from raw data to actionable insights faster than ever before.


