
Retail Metrics & KPIs: How to Measure Store Performance Effectively
Learn how to measure store performance using retail metrics and KPIs. A practical framework covering demand, conversion, basket value, and inventory with real examples.


Introduction
Retail teams today don’t lack data, they lack clarity. Most businesses track dozens of retail KPIs, retail metrics, and store performance indicators, yet still struggle to understand why performance shifts week to week. A store doesn’t suddenly lose revenue; it weakens across layers, traffic, conversion, basket size, or inventory execution, before showing up in sales reports. That’s why tracking retail KPIs without a system often leads to delayed decisions and missed opportunities.
According to McKinsey, retailers that use integrated KPI systems improve operational efficiency by up to 20%. The difference isn’t more data, it’s connecting the right metrics to the right actions. This guide breaks down how to structure retail performance metrics into a decision-driven system that actually improves store outcomes.
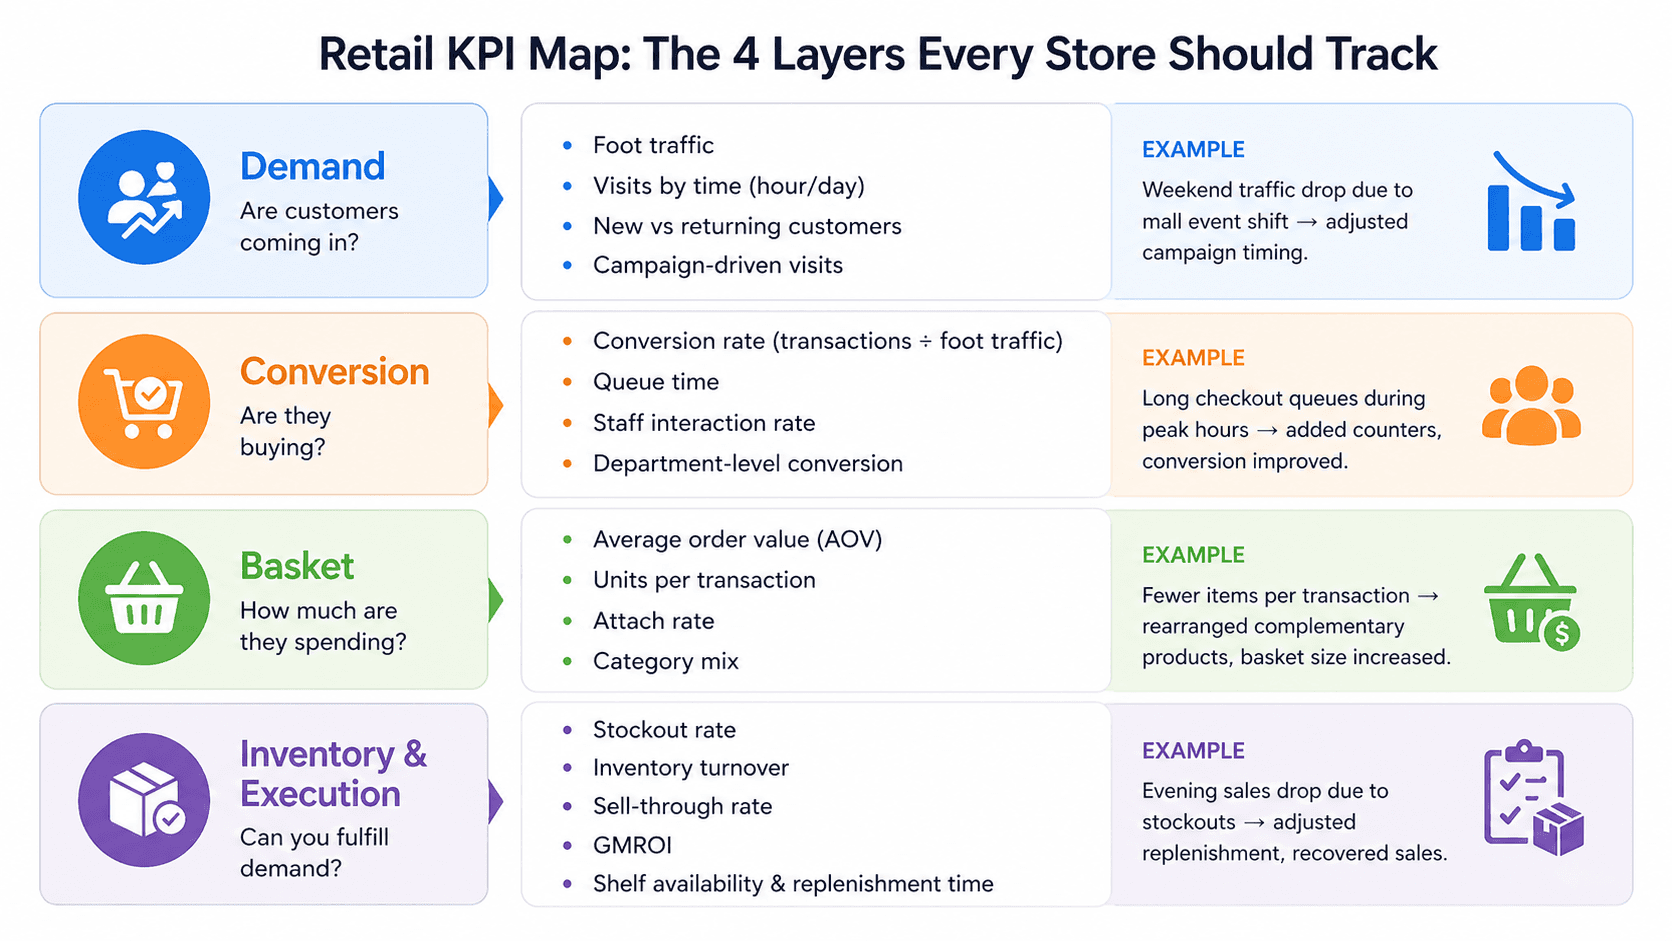
Retail KPI Map: The 4 Layers Every Store Should Track
A high-performing retail system doesn’t track random metrics. It organizes KPIs into four layers:
Demand → Are customers coming in?
Conversion → Are they buying?
Basket → How much are they spending?
Inventory & Execution → Can you fulfill demand?
This layered approach helps identify where performance breaks, before it hits revenue.
Demand KPIs
Demand KPIs measure whether customers are entering your store ecosystem. These include foot traffic, store visits by time, new vs returning customers, and campaign-driven visits. According to RetailNext, over 65% of store performance issues originate from demand fluctuations, not in-store execution. Tracking hourly and daily traffic patterns helps identify when and why demand changes, weather, promotions, competitor activity, or location trends. For example, a drop in weekend traffic but stable weekday traffic often signals external demand shifts rather than internal problems. Demand KPIs also help allocate marketing budgets more efficiently by identifying which campaigns drive actual store visits instead of just impressions.
Example
A fashion retailer noticed a 10% drop in weekly sales. Demand KPIs showed foot traffic declined only on Saturdays. Further analysis revealed a nearby mall event shift. Instead of discounting products, they adjusted campaign timing, recovering traffic without impacting margins.
Conversion KPIs
Conversion KPIs determine whether store visitors are actually purchasing. The most critical metric is conversion rate (transactions ÷ foot traffic), but deeper insights come from queue time, staff interaction rate, and department-level conversion. According to a study by Deloitte, improving conversion rates by just 5% can increase store revenue by up to 20%, since fixed costs remain unchanged. A drop in conversion often signals in-store execution issues, staffing gaps, poor layout, stockouts, or pricing friction. High foot traffic with low conversion is one of the clearest indicators of operational inefficiency. Tracking conversion by time slot and department helps pinpoint bottlenecks rather than blaming overall performance.
Example
An electronics store saw strong foot traffic but declining sales. Conversion KPIs revealed a 15% drop during peak hours. Investigation showed long checkout queues. Adding two checkout counters improved conversion within a week, increasing revenue without additional marketing spend.
Basket KPIs
Basket KPIs measure how much value each transaction generates. These include average order value (AOV), units per transaction, attach rate, and category mix. According to Shopify data, increasing AOV by 10% can improve profitability significantly without acquiring new customers. Basket KPIs reveal merchandising effectiveness, whether customers are buying complementary products or just single items. A declining AOV often signals weak cross-selling, ineffective promotions, or poor product placement. Unlike demand or conversion, basket KPIs directly impact margins, making them critical for profitability-focused retailers.
Example
A supermarket observed stable conversion but declining revenue. Basket KPIs showed a drop in units per transaction. Rearranging complementary products, placing snacks near beverages, increased basket size within two weeks, improving revenue without changing pricing.
Inventory & Execution KPIs
Inventory and execution KPIs ensure that demand can be fulfilled. These include stockout rate, inventory turnover, sell-through rate, GMROI, and shelf availability. According to IHL Group, global retailers lose nearly $1 trillion annually due to stockouts and overstocks. High demand and strong conversion mean little if key products are unavailable. Inventory KPIs help identify whether products are moving efficiently or locking up capital. Execution KPIs like replenishment time and planogram compliance ensure that operational processes support sales. These metrics are especially critical in grocery and fast-moving retail environments where timing directly impacts sales outcomes.
Example
A grocery store faced declining evening sales despite strong daytime performance. Inventory KPIs showed fresh items were out of stock after 6 PM. Adjusting replenishment schedules improved availability during peak hours, recovering lost sales without increasing inventory levels.
How to Diagnose Retail Performance Using KPIs (A Practical Framework)
Tracking retail KPIs is relatively easy, most teams already have dashboards and reports in place. The real challenge begins when performance drops and teams struggle to identify the actual cause. Without a structured approach, businesses often react to surface-level symptoms like declining sales instead of understanding what truly went wrong beneath the numbers.
A better approach is to break performance into layers and analyze each step logically. Start with the final outcome, usually a revenue change, but avoid reacting immediately. Revenue is the result of multiple underlying factors, and isolating the correct one is key to making the right decision.
The first step is to evaluate demand. If foot traffic has dropped, the issue is likely external, such as changes in marketing effectiveness, seasonal patterns, or competitive activity. In this case, improving store execution will not solve the problem because fewer customers are entering the store.
If demand remains stable, the next layer to analyze is conversion. A drop in conversion typically indicates in-store execution issues. These may include insufficient staffing, long checkout queues, poor product visibility, or limited product availability. Fixing these operational gaps can often recover lost revenue quickly.
If conversion is also stable, attention should shift to basket metrics. A decline in average order value or items per transaction suggests that customers are still buying but spending less. This usually points to merchandising issues, weak cross-selling, or changes in pricing or promotions.
Finally, inventory and execution should be evaluated. Even when demand and conversion are strong, stockouts, delayed replenishment, or poor shelf availability can reduce sales. Many retailers underestimate how often inventory constraints quietly impact performance.
Large retailers like Walmart rely on real-time KPI monitoring to track inventory availability and customer behavior across stores. This allows them to detect issues such as stockouts or demand shifts immediately and take corrective action faster than traditional reporting systems.
This layered approach removes guesswork and creates a clear path from problem to solution. Instead of reacting to outcomes, teams can identify root causes and act with precision.
Retail KPI Implementation Framework
Building an effective retail KPI system requires more than just selecting metrics. It requires clarity around how each KPI supports decision-making and operational improvement. Without this structure, dashboards become informational rather than actionable.
The first step is defining the business objective behind each KPI. Every metric should exist for a reason, whether it is to improve revenue, reduce stockouts, or increase conversion. It is also important to assign ownership, define how frequently the KPI should be reviewed, and establish what action should be taken when it changes.
Next, store performance tracking should be structured in a way that allows meaningful comparisons. Traffic and conversion must always be analyzed separately, as combining them hides important insights. Additionally, stores should be compared based on relevant factors such as location, size, and format, rather than using a single universal benchmark.
Inventory tracking is another critical component of a strong KPI system. Retailers should monitor stockouts at the SKU level, identify fast-moving products separately, and track sell-through rates across categories. Relying only on sales metrics without understanding inventory efficiency often leads to poor decision-making.
Finally, dashboards must be designed for usability and action. Users should be able to drill down from high-level performance to detailed insights, such as moving from region-level data to specific stores or products. Alerts should be configured to notify teams of significant KPI changes, and benchmarks should reflect realistic comparisons rather than generic averages.
When these elements are combined, KPIs evolve from static reports into a system that supports continuous improvement.
Common Retail KPI Mistakes That Limit Performance
One of the most common mistakes retailers make is tracking too many KPIs. While it may seem beneficial to monitor everything, excessive data often creates confusion rather than clarity. Teams struggle to prioritize, and important signals get lost in noise.
Another frequent issue is ignoring differences between stores. Retail environments vary significantly based on location, customer demographics, and store format. Applying the same benchmarks across all stores can lead to inaccurate conclusions and ineffective strategies.
A critical mistake is the lack of action mapping. Many organizations track KPIs without clearly defining what should happen when a metric changes. Without predefined actions, KPIs become passive indicators rather than tools for decision-making.
Static reporting is another limitation. Retail operates in real time, but many teams rely on weekly or monthly reports. By the time an issue is identified, the opportunity to correct it may already be lost.
Finally, many retailers fail to connect inventory with sales performance. Stockouts, overstocking, and replenishment delays are often the hidden causes behind declining revenue. Ignoring this connection results in incomplete analysis and missed opportunities for improvement.
Turn your raw data into clear, interactive dashboards with Supaboard. Instead of static reports, instantly convert your metrics into powerful visualizations, charts, trends, and insights you can actually act on. From retail KPIs to real-time performance tracking, Supaboard helps you understand what’s happening and why. Create your data into visualizations like this and make faster, smarter decisions without complexity.
Final Takeaway: Turning KPIs into a Decision System
Retail KPIs should not be viewed as isolated numbers. They are signals that, when structured correctly, provide a clear understanding of store performance. A strong KPI system answers three essential questions: what changed, why it changed, and what action should be taken next.
Retailers that treat KPIs as simple reporting tools often react too late, addressing symptoms rather than causes. In contrast, those that build structured KPI systems can detect issues early and respond with precision.
The ultimate goal is not to collect more data but to reduce the time between insight and action. When KPIs are connected to decisions, they become a powerful driver of operational efficiency and business growth.


