
Top AI Analytics Tools Transforming Data Analysis in 2025-2026
Have you noticed how some teams make smart, data driven decisions in minutes, while others still wait days for reports? That’s because AI-powered analytics is changing how we all work. Tools built with AI aren’t just helping us see data faster, they’re helping us understand it better. Now, AI-driven tools turn raw data into instant insights accessible to everyone, from beginners to experts. This guide explores how to leverage AI-powered analytics tools in 2025 and 2026 to stay ahead of the curve.


The way businesses use data is changing fast. In 2025–2026, companies are no longer just looking for dashboards, they’re searching for the best AI tools for data analysis, AI-powered analytics platforms, and real-time data integration tools that can turn raw data into decisions instantly. Traditional BI tools often required technical expertise, but modern AI analytics tools are designed for speed, accessibility, and business impact.
Today’s leading platforms combine AI-powered data management, predictive analytics, and natural language querying to help teams understand trends, customer behavior, and performance without writing complex queries. Whether it’s identifying growth opportunities, improving customer experience, or optimizing operations, businesses are actively adopting the top AI analytics tools for 2025–2026 to stay competitive.
As data volumes grow and decision cycles shrink, the focus is shifting toward tools that not only analyze data but also explain it clearly and recommend next steps in real time.
What “Transforming Data Analysis” Really Means Now
Transformation isn’t just about building new dashboards or using more advanced visuals. It’s about saving time, reducing errors, and making insights accessible to everyone, not just data experts.
The real shift is happening in how people interact with data. With modern AI-powered analytics tools, teams can move faster, rely less on manual processes, and make better decisions without deep technical knowledge. Data is no longer something you wait on—it’s something you can explore, understand, and act on instantly.
We now have tools powered by large language models that understand plain English. They clean, organize, and explain data in ways anyone can use. According to Gartner, by 2027 over half of large companies will use AI copilots or assistants in their BI workflows and that number will keep growing fast.
What’s Changing in Business Analytics for 2026
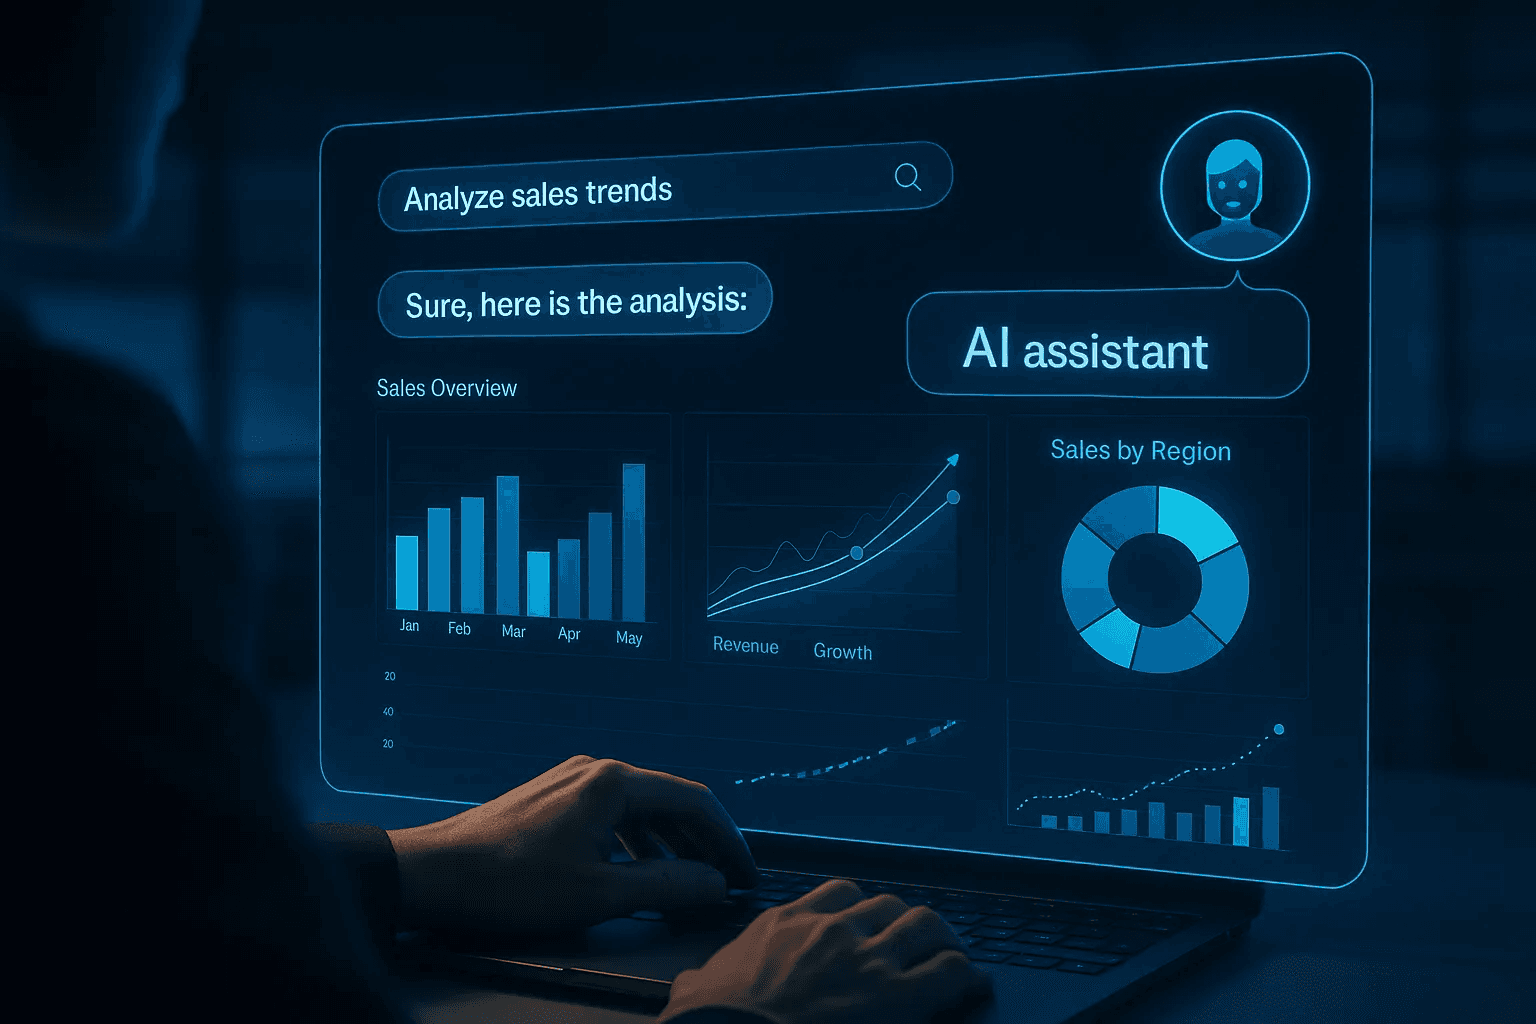
By 2026, dashboards will evolve from static visuals to interactive, intelligent assistants. Instead of just clicking filters or waiting for analysts, users can now talk, type, or even upload images to get answers instantly.
For example, ask “Why did our sales drop in the North region last quarter?” and the dashboard powered by tools like **Power BI Copilot, Supaboard (stella), or Tableau GPT** will analyze patterns, compare trends, and present a clear visual explanation with supporting insights.
These smart dashboards understand natural language, automatically create relevant charts, and even suggest next steps turning data analysis into a simple conversation rather than a technical task.
Case Study: Apollo Hospitals (India, 2025)
Apollo Hospitals adopted AI-powered dashboards to ease staff workload and improve hospital efficiency. Integrated with EMR and staffing data, the system let managers ask natural questions like “Which wards will face bed shortages tomorrow?”
Results:
Reduced doctors’ and nurses’ admin time by 2–3 hours daily.
Improved bed management and reduced patient wait times.
Enabled real-time, data-driven decisions through interactive dashboards.
“Source: Reuters “
The Rise of Conversational BI
Teams “talk” to dashboards using plain English through natural language queries (NLQ).
Large Language Model (LLM)–powered systems understand vague or complex questions, democratizing data access.
By 2026, platforms will support multi-modal analytics that include voice, text, and image for even richer insights.
How Is AI Rebuilding Data Analysis Workflows?
1. Automating Data Cleaning
AI handles routine work like removing duplicates, finding missing values, and flagging errors. That means fewer manual steps and more time to focus on finding what really matters.
2. Quick Visuals and Reports
Platforms such as Tableau GPT, Supaboard and Julius AI can build charts and summaries in seconds. You just describe what you want, and the system creates the visuals. It turns hours of work into a few clicks.
3. Connecting Every Data Source
With real-time syncing and data mesh setups, it’s now easy to pull CRM, marketing, and many other data sources into one place. That live view helps teams decide faster and stay ready for quick market changes.
Best AI Data Analytics Tools in 2025–2026
Tool | Core Feature | Best For | AI/Automation | Why It Stands Out |
|---|---|---|---|---|
Power BI Copilot | Predictive analytics, MS integration | Enterprises using Microsoft tools | AI copilot, Azure ML, NLQ | Strong Microsoft connection and forecasting power |
No-code, natural language BI | Startup and enterprises | Instant Q&A, AI reporting & dashboards | Super fast setup, simple to use | |
Smart storytelling and visuals | Enterprises and analysts | Ask Data, GPT dashboards | Great for narrative and data visuals | |
Open-source, embeddable BI | SaaS and product teams | Embedded AI queries | Easy to embed and customize | |
Qlik Sense | Associative data model | Finance, healthcare, supply chain | AutoML, smart alerts | Finds pattern links others miss |
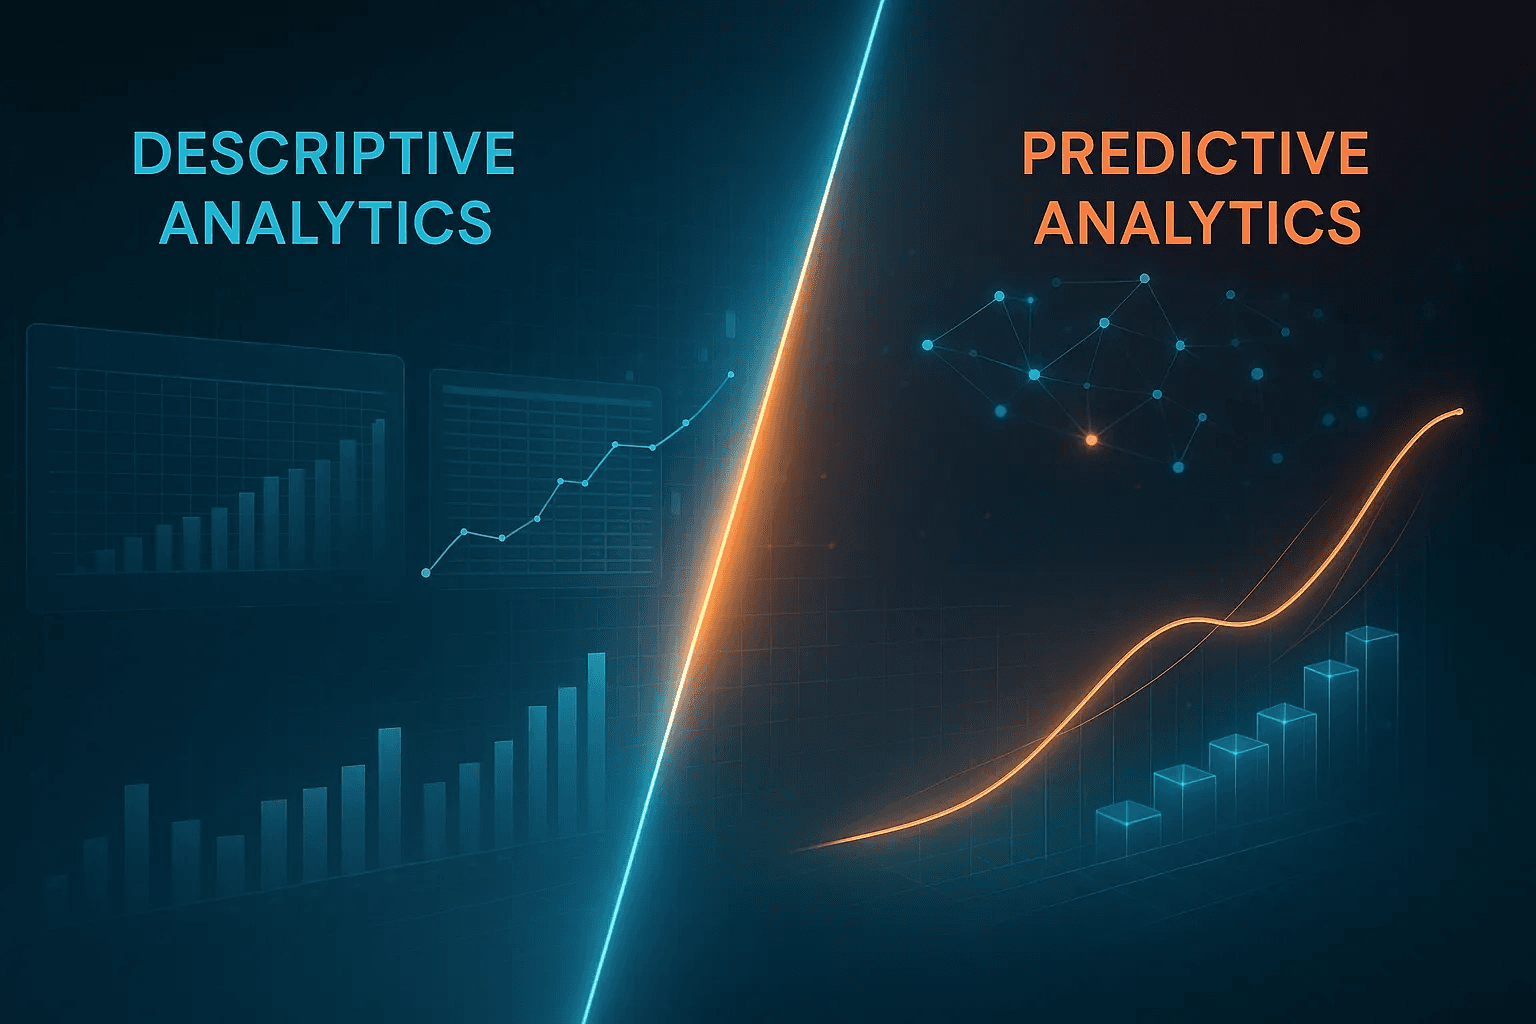
Predictive vs. Descriptive Analytics: What Matters More?
Descriptive analytics reveals what has already happened. For example, past quarter revenue.
Predictive analytics forecasts what might happen next. Such as expected sales next month.
In 2026, organizations will commonly combine both, leveraging real-time predictive modeling as standard practice.
Why These BI Tools Are Leading the Market
Power BI Copilot dominates with deep Microsoft ecosystem integration and enterprise predictive analytics.
Supaboard democratizes reporting with blazing speed and no-code simplicity, perfect for startups and enterprises.
Tableau GPT excels at turning data into compelling, story-driven visualizations.
Metabase offers open-source flexibility favored by product teams wanting embedded analytics.
Qlik Sense leverages associative data modeling to uncover complex insights in demanding sectors.
How AI Analytics Drives Business Impact
A mid-sized retail business cut report generation time by 80%, accelerating campaign responsiveness and dramatically improving ROI. Leaders moved from “waiting” on data to acting on insights in near real time.
Business Tips:
Start with a single analytics use case to prove value.
Validate AI-generated insights before enterprise rollout.
Automate recurring reporting tasks.
Track AI ROI via time-to-insight and decision accuracy.
Case Study: Global Retail Enterprise Supaboard (Stella AI)
In 2025, a leading global retail enterprise struggled to identify where and why sales were dropping across regions. Reports came late, and only data specialists could interpret them leaving business teams guessing.
After implementing Supaboard (Stella AI), the company unified sales, marketing, and inventory data into one conversational dashboard. Now, anyone on the team from finance to regional managers can simply ask, “Where are we losing revenue?” and instantly see clear, visual insights.
Pain point solved: Earlier, spotting regional losses required complex manual analysis. With Supaboard, the insights are immediate, easy to understand, and accessible to everyone empowering the whole team to make faster, smarter decisions.
(Client name confidential for privacy)
“The real power of AI analytics isn’t just in faster reports it’s in helping every team member make smarter decisions without needing a data scientist”
Why User Experience Is Crucial for Data Strategy
Analytics platforms must be:
Intuitive and clean.
Equipped with guided onboarding.
Accessible on mobile devices.
Collaborative for cross-team use.
Data literacy programs ensure insights don’t stay siloed but drive action company-wide.
Why Simplicity and User Flow Matter Most
Even with smart AI, user experience decides if teams actually use the tools. Dashboards that are easy to navigate, look clean, and guide users step by step always perform better.
Simple design plus trustworthy AI results equal faster adoption and more confident decision-making across teams.
Frequently Asked Questions
What are the best AI tools for data integration in 2025–2026?
The best AI tools for data integration in 2025–2026 focus on real-time syncing, automated data pipelines, and minimal manual setup. Platforms like modern ETL tools and AI-powered connectors help businesses unify data from multiple sources, ensuring faster access to clean, reliable datasets for analytics and decision-making.
What are the best AI tools for data analysis in 2026?
The best AI tools for data analysis in 2026 combine natural language querying, automated insights, and predictive modeling. These tools allow users to ask questions in plain English, generate charts instantly, and uncover patterns without technical expertise, making data analysis faster and more accessible across teams.
Which AI analytics tools are best for understanding customer behavior?
AI analytics tools for customer behavior focus on tracking user journeys, segmenting audiences, and identifying patterns in engagement and retention. These platforms use machine learning to highlight trends, predict churn, and provide actionable insights that help businesses improve customer experience and personalize interactions effectively.
What are the top AI-powered data analytics platforms for businesses?
Top AI-powered data analytics platforms offer features like real-time dashboards, automated reporting, and AI-driven recommendations. They help businesses analyze large datasets quickly, generate insights without manual effort, and support decision-making across departments with scalable and easy-to-use analytics capabilities.
What are the most reliable AI database and analytics tools?
Reliable AI database and analytics tools prioritize data accuracy, governance, and performance. They provide strong integration capabilities, secure data handling, and consistent query results, ensuring businesses can trust their data for reporting, forecasting, and operational decision-making without frequent errors or inconsistencies.
Which analytics tools offer predictive modeling capabilities?
Analytics tools with predictive modeling capabilities use historical data and machine learning algorithms to forecast future outcomes. These tools help businesses anticipate trends, optimize strategies, and reduce risks by providing data-driven predictions, making them essential for planning, budgeting, and long-term growth decisions.
Final Thoughts: Turn Data into Decisions
The future of business isn’t just about having more data, it’s about making faster, smarter decisions from it. In 2025–2026, the best AI analytics tools are helping teams move beyond static reports toward real-time insights, predictive analytics, and automated decision-making. The companies that win will be the ones that can act on data instantly, not just analyze it.
Whether you're exploring AI tools for data analysis, data integration platforms, or customer analytics solutions, the key is to start small and scale fast. Focus on one business problem, implement the right tool, and build momentum as your data maturity grows.
If you want to experience this shift firsthand, start with Supaboard’s AI-powered dashboards, designed to turn complex data into simple, conversational insights that drive real action.


