
Power BI vs Tableau: Which is Better in 2026?
How to choose between Power BI & Tableau? the final decision depends on the unique needs & requirements of your organization. Read below to know more.


Most Power BI vs Tableau articles follow the same pattern, feature lists, generic pros and cons, and surface-level conclusions. You’ll often see the same talking points repeated: Power BI is cheaper, Tableau is better for visualization, and both are “powerful tools.” While that’s technically true, it doesn’t help when you’re actually trying to decide which tool fits your workflow.
But after using both tools in real-world environments, those comparisons rarely reflect what actually matters. The real differences between Tableau vx Power BI only start to show when you move beyond demos, when you’re building dashboards at scale, managing data models, dealing with performance issues, and supporting business teams that rely on your reports daily.
In this article, we’re not going to repeat definitions or vendor claims. Instead, this is based on practical usage, analyst workflows, and common issues surfaced across data teams and communities. We’ll cover key areas like Power BI pricing vs Tableau pricing, ease of use, visualization flexibility, and real-world limitations, so you can understand not just the differences, but the trade-offs.
The goal is simple, help you understand how these tools behave when you actually depend on them, and make a more informed decision based on your team’s needs.
A Quick Feature Look.
At a high level, the Power BI vs Tableau comparison comes down to how each tool expects you to work with data.
Power BI leans toward a model-first approach. You define relationships, measures, and structure upfront, and then build reports on top of that. This works well when teams need consistency, but it also means more upfront effort and ongoing maintenance as the model grows.
Tableau takes a more visual-first approach. You can connect data and start exploring almost immediately, which makes it easier for quick analysis. However, because there’s less emphasis on a centralized model, teams often end up defining logic in multiple places, which can create inconsistencies over time.
Both tools are capable, but they behave differently once you move beyond simple dashboards. Power BI tends to be more predictable but rigid, while Tableau is more flexible but harder to standardize. As data and usage scale, these differences become more noticeable in day-to-day workflows.
For a broader comparison, explore the top 10 BI tools in 2026 for modern analytics.
Core Features Breakdown
Power BI: Where It Stands Out
1. Integration with Microsoft ecosystem
Power BI fits naturally into Microsoft-based environments by connecting directly with Excel, Azure, SQL Server, and Teams. This reduces setup effort and simplifies data movement across systems. For organizations already using Microsoft tools, this integration lowers friction and enables faster adoption without introducing additional infrastructure or connectors.
2. Data preparation and centralized modeling
Power BI is strong in handling data before visualization. Power Query enables efficient transformation, while relationships and DAX support structured modeling across datasets. This allows teams to build reusable data layers for reporting. However, as models scale, maintaining calculations and dependencies becomes more complex and resource-intensive.
3. Scalable for standardized reporting workflows
Power BI works well for recurring dashboards where consistency is required across teams. Once a model is defined, multiple reports can rely on the same logic, ensuring alignment in metrics. This makes it particularly useful for operational and financial reporting environments where accuracy and repeatability are critical.
4. Fabric and unified analytics ecosystem (new capability)
Microsoft is positioning Power BI as part of its broader Fabric ecosystem, combining data engineering, warehousing, and analytics into one platform. This shift allows teams to manage data pipelines, storage, and reporting in a unified environment, reducing the need for separate tools across the data lifecycle.
5. Limited flexibility for advanced visual customization
Power BI supports standard visualizations effectively, but advanced customization often requires third-party visuals. This introduces dependency on external components and limits control over detailed design elements. As dashboards become more complex, maintaining consistency and performance across custom visuals can become challenging.
If you're looking for an AI-powered BI tool like Supaboard, you can explore a detailed comparison here: Supaboard vs Power Bi.
Tableau: Where It Stands Out
1. Advanced visualization and design flexibility
Tableau provides deeper control over how data is presented, allowing analysts to customize layouts, interactions, and visual elements extensively. This makes it suitable for complex dashboards and storytelling scenarios where presentation quality matters. Analysts can create highly tailored visualizations without relying on external components.
2. Faster exploratory analysis workflows
Tableau enables rapid data exploration without requiring a predefined model. Its drag-and-drop interface allows analysts to test ideas quickly and iterate across multiple views. This makes it effective for early-stage analysis or situations where the structure of the data is still evolving.
3. Intuitive analytical interface for users
Tableau organizes data into dimensions and measures, making it easier to understand and manipulate datasets. This approach reduces the need for complex logic during initial exploration and allows analysts to focus on patterns and insights rather than data structure, especially in ad-hoc analysis scenarios.
4. Tableau Pulse and AI-driven insights (new capability)
Tableau is evolving toward proactive analytics with features like Tableau Pulse, which automatically surfaces insights and changes in data. This shifts dashboards from static reporting tools to more dynamic systems that highlight trends and anomalies, reducing the need for users to manually explore data continuously.
5. Challenges in maintaining consistency across dashboards
Tableau’s flexibility allows calculations to be defined at multiple levels, which can lead to inconsistent metrics across reports. Without a centralized model, teams often create different versions of the same logic. As the number of dashboards grows, maintaining alignment across teams becomes increasingly difficult.
Explore how Supaboard compares with Tableau in modern analytics workflows: Supaboard vs Tableau
Limitations of Power BI and Tableau (That No One Talks About)
Power BI Limitations
1. Model complexity increases rapidly at scale
Power BI’s centralized data model becomes difficult to manage as datasets and relationships grow. DAX measures, calculated columns, and dependencies create tightly coupled logic that is hard to debug or modify. This slows down iteration and makes onboarding new analysts challenging in complex reporting environments.
2. Heavy reliance on DAX for advanced analysis
Power BI requires DAX for most non-trivial use cases, and its complexity increases quickly as business logic evolves. Maintaining large sets of measures becomes difficult, especially when multiple reports depend on shared calculations, creating a strong dependency on experienced developers for even small changes.
3. Performance tuning requires manual optimization
Power BI performance depends heavily on model design, aggregation strategies, and query optimization. Out-of-the-box performance is often insufficient for large datasets, requiring careful tuning of relationships, filters, and DAX queries. Without proper optimization, dashboards can become slow and difficult to scale efficiently.
Tableau Limitations
1. Lack of centralized metric governance
Tableau allows calculations to be defined within individual dashboards, which creates flexibility but reduces consistency. Over time, teams often implement the same metric in different ways across reports, making it difficult to maintain a single source of truth and increasing effort in validating data accuracy.
2. Limited data preparation capabilities
Tableau is less effective for complex data transformation compared to modeling-focused tools. While Tableau Prep exists, many teams rely on external systems for cleaning and structuring data. This adds extra steps to the workflow and increases dependency on engineering or upstream data pipelines before analysis.
3. Performance challenges with live and extract workflows
Tableau requires careful management of live connections and extracts to maintain performance. Large datasets often need extract optimization or pre-aggregation, and poor configuration can lead to slow dashboards. Performance tuning is less centralized, making it harder to standardize across multiple dashboards and teams.
Common issue seen in companies using Power BI and Tableau
Across many organizations, a common issue with Power BI and Tableau is fragmented data logic. Power BI concentrates complexity within centralized models, while Tableau distributes calculations across dashboards. As usage scales, this leads to duplicated metrics, inconsistent definitions, and increased effort in validating reports. Teams often struggle to maintain a single source of truth, especially when multiple analysts build dashboards independently. This pattern is widely discussed in industry and training communities, including analyses by The Data School, where consistency and governance are highlighted as ongoing challenges.
Across both tools, analysts typically spend up to 40% of their time maintaining dashboards and fixing issues, rather than generating insights, especially as datasets and reporting requirements scale.
Based on industry use cases, many U.S. pharmaceutical and healthcare organizations use both Power BI and Tableau in parallel, Power BI for operational reporting and Tableau for advanced analytics and visualization. This reflects a broader trend where teams don’t rely on a single BI tool but instead choose based on specific workflows, balancing governance with flexibility.
What Users Say About Power BI vs Tableau
As shown in the image above, we reviewed user ratings and feedback from platforms like G2, Capterra, and Gartner Peer Insights to understand how Power BI vs Tableau performs in real-world usage. While ratings across both tools remain closely matched, deeper insights from user discussions reveal more practical differences beyond surface-level scores.
Power BI
Users consistently highlight Power BI’s strong integration with the Microsoft ecosystem and its cost advantage, making it a practical choice for many organizations. However, in community discussions, users often mention that deeper usage becomes complex due to DAX and data modeling requirements. As one Reddit user noted, “Power BI is more complex when you start looking under the hood” (source).
At the same time, many professionals prefer it for enterprise adoption because it scales well within existing Microsoft environments. Industry analyses also confirm that Power BI is widely used for structured reporting and operational dashboards due to its accessibility and integration capabilities.
Tableau
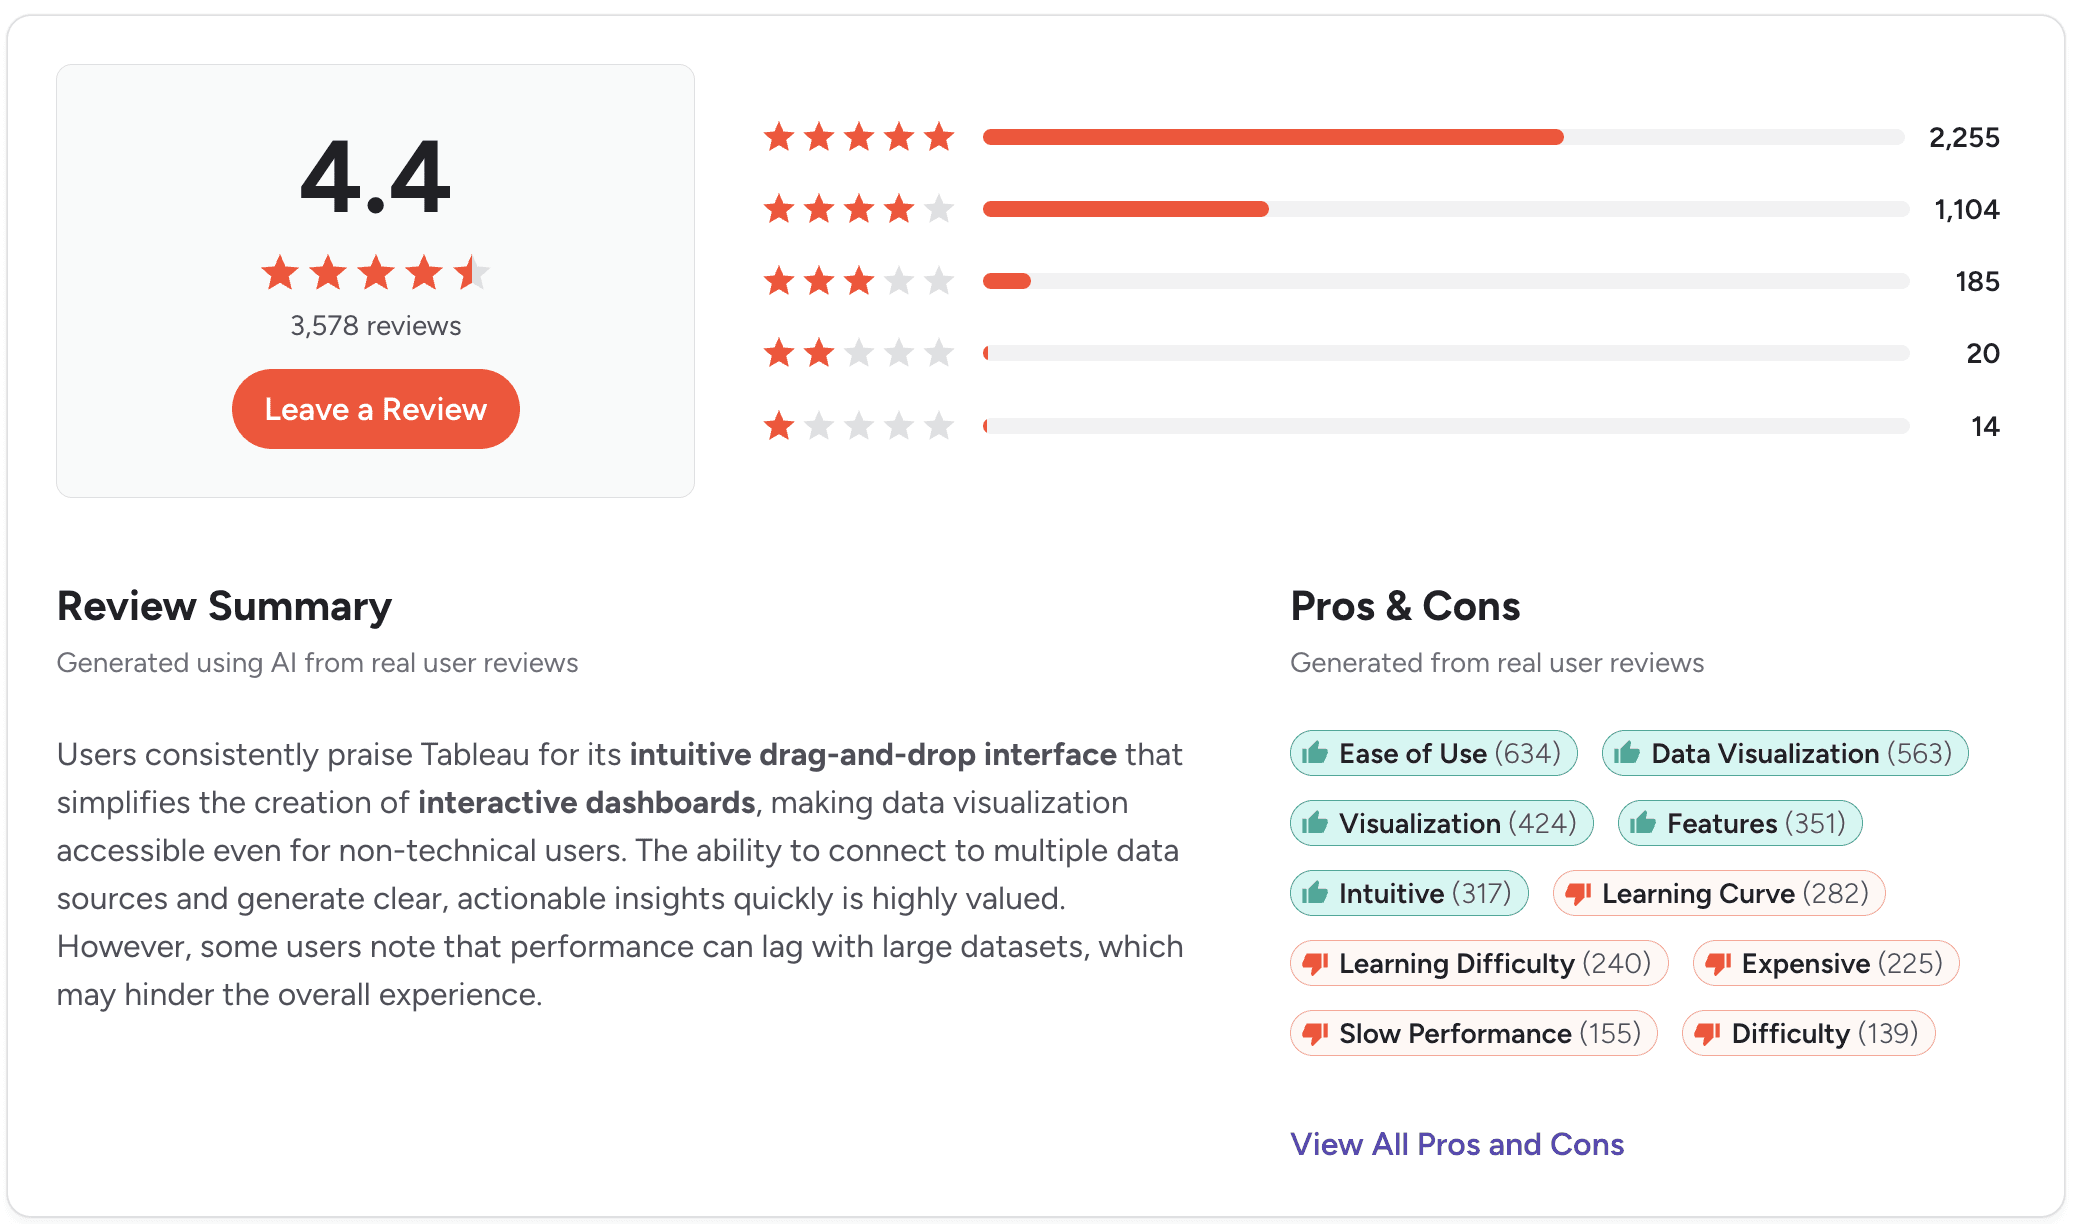
Tableau is frequently praised for its visualization flexibility and intuitive interface, especially for exploratory analysis. Many users in Reddit and Quora discussions highlight that Tableau “just works” when building complex visualizations, with fewer workarounds compared to Power BI .
However, users also point out challenges around cost and consistency, particularly in larger teams where multiple dashboards are created independently. While Tableau excels in visualization and user experience, maintaining alignment across dashboards becomes difficult as usage scales.
To understand the broader landscape, explore business intelligence tools shaping modern data workflows.
What’s Actually Different in Practice
Ease of Use
Ease of use depends largely on your background and workflow.
Power BI feels more natural if you come from Excel, Power Query, or relational database environments. It integrates well into that ecosystem, but as soon as you move beyond basic dashboards, DAX becomes necessary, and complexity increases quickly, especially with larger models.
Tableau is easier for quick analysis. Its drag-and-drop interface and shelf-based design allow analysts to explore data without defining a full structure upfront, making it more intuitive for exploratory workflows.
Visualization Flexibility
This is one of the most noticeable differences between the two tools.
Tableau provides greater control over design, including layouts, tooltips, colors, and interactions. This makes it more suitable for building custom dashboards and data storytelling experiences.
Power BI is more structured. While it supports most standard visualizations, advanced customization often depends on third-party visuals, which can introduce limitations and inconsistencies.
In practice:
Tableau works better for custom, design-heavy dashboards
Power BI works better for standardized, repeatable reporting
Data Modeling and Data Preparation
Power BI is stronger in handling data before visualization.
Power Query allows teams to clean and transform data directly, while its model-first approach with relationships and DAX ensures consistency across reports. This is useful for building reusable datasets, especially in structured reporting environments.
Tableau is less focused on transformation. While it offers preparation tools, many teams prefer cleaning data externally before using Tableau for analysis.
Practical distinction:
Power BI is stronger before visualization
Tableau is stronger during analysis
Dashboard Behavior and Workflow
Differences in interaction design become more visible over time.
Power BI includes automatic cross-filtering and synchronization, which simplifies how dashboards behave. Features like bookmarks make it easier to manage user interactions and control views without additional setup.
Tableau requires more manual configuration. Filters, parameters, sets, and highlights behave differently, which increases flexibility but also adds complexity in larger dashboards.
Impact:
Power BI simplifies interaction management
Tableau provides more control but requires more setup
Flexibility vs Consistency
This is the core trade-off between the two tools.
Power BI enforces consistency through its centralized data model, ensuring metrics remain aligned across reports. However, this structure can slow down exploration when new questions arise.
Tableau allows faster iteration and deeper exploration, but often at the cost of consistency, as metrics can be defined differently across dashboards.
In practice:
Power BI prioritizes control and standardization
Tableau prioritizes flexibility and speed
Power BI vs Tableau Pricing
Power BI is generally more cost-effective, especially for teams already using Microsoft tools. It offers a free version and paid plans starting around $10 per user/month, with Premium capacity scaling for enterprise needs.
Official pricing.
Tableau uses a role-based pricing model with Creator, Explorer, and Viewer licenses. Costs start higher (around $70/user/month for Creator) and increase as more users require advanced access.
Official pricing.
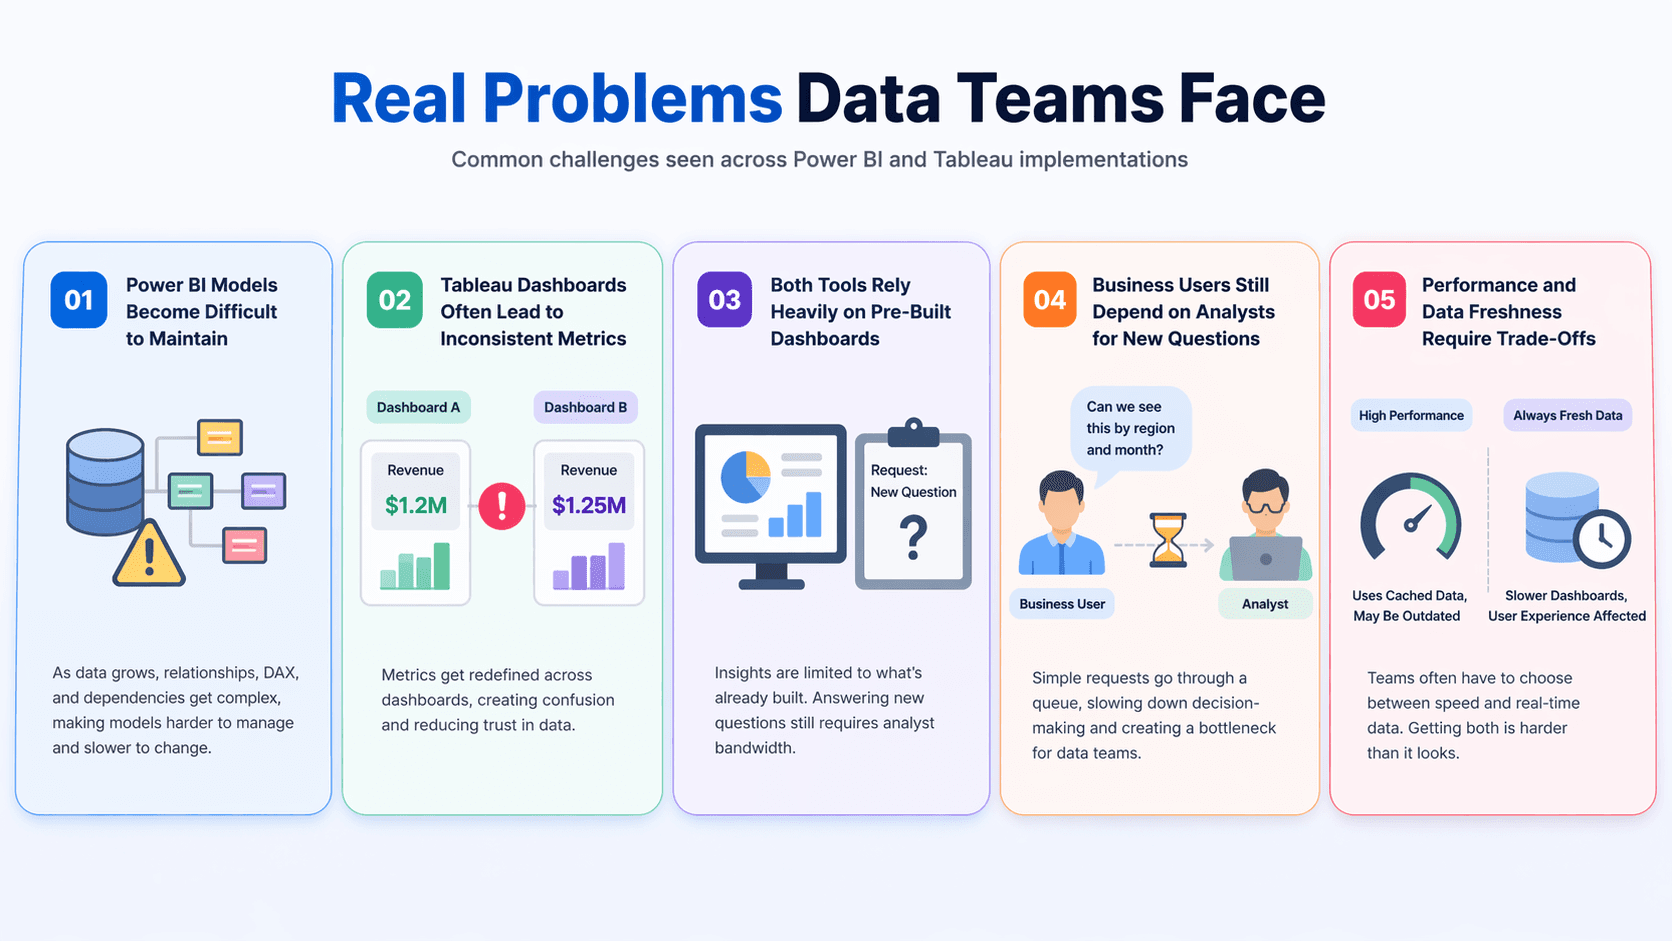
Real Problems Data Teams Face
When to Use Power BI vs Tableau
From an analyst’s perspective, the Power BI vs Tableau decision is rarely about features alone. In practice, it comes down to how your team handles data, builds reports, and scales analytics over time. Both tools can solve similar problems, but they fit very different workflows.
Power BI
Integration with Microsoft Ecosystem
Power BI works best when your organization already relies on Microsoft tools like Excel, Azure, and Teams. It connects seamlessly across this ecosystem, allowing teams to move from spreadsheets to dashboards without friction. Many users highlight that this integration significantly reduces setup effort and improves adoption across business teams.Data Transformation and Modeling
Power BI is particularly strong in data preparation and modeling. With Power Query and DAX, it allows teams to clean, transform, and structure data within the platform itself. This makes it more suitable for environments where data is not perfectly structured and requires ongoing transformation before analysis.Cost-Effective at Scale
Power BI is generally more affordable, especially for organizations already using Microsoft products. Its pricing model allows teams to provide access to a larger number of users without significantly increasing costs, which is often a deciding factor for enterprise adoption.Accessible for Beginners (Initial Learning Phase)
Power BI offers a relatively accessible starting point, especially for users familiar with Excel or basic data concepts. While advanced usage becomes more complex due to DAX, the initial learning curve is manageable for business users entering analytics workflows.
Tableau
Visual Appeal and Customization
Tableau stands out for its ability to create highly customized and visually refined dashboards. Analysts can control almost every aspect of design, making it ideal for storytelling, presentations, and complex visualizations where standard charts are not sufficient.User-Friendly Interface for Analysis
Tableau’s interface is often described as more intuitive for exploration. Actions like formatting, adjusting visuals, or modifying layouts are straightforward, which allows analysts to build and iterate quickly without navigating complex configurations.Strong for Data Exploration and Ad-Hoc Analysis
Tableau excels in exploratory workflows where users need to interact with data dynamically. It allows analysts to test ideas, adjust views, and uncover patterns without defining a strict structure upfront, making it highly effective for discovery-based analysis.Better Support for Mac and Cross-Platform Use
Unlike Power BI, Tableau runs natively on macOS, making it a practical choice for teams that are not Windows-based. This flexibility is often a key factor for organizations or analysts working in mixed or non-Microsoft environments.
Key Insight
Power BI fits better in structured, Microsoft-driven environments with strong reporting needs
Tableau fits better in analyst-driven environments focused on exploration and visualization
In real-world usage, the choice is less about which tool is better, and more about which workflow your team can scale without friction.
Frequently Asked Questions FAQs
Which is better: Power BI or Tableau?
There is no clear better tool, it depends on workflow. Power BI is stronger for structured reporting and centralized data models, while Tableau is better for exploration and visualization. As many practitioners note, both tools perform well, but the difference becomes clear when scaling dashboards and maintaining data consistency.
What is the main difference between Power BI and Tableau?
The main difference lies in how they handle data. Power BI uses a model-first approach where logic is centralized, while Tableau allows logic to be created within dashboards. This makes Power BI more consistent and Tableau more flexible, but also harder to standardize over time.
Is Power BI easier to learn than Tableau?
Power BI is easier if you come from Excel or database backgrounds, since it builds on familiar concepts like relationships and queries. Tableau is easier for quick visual exploration, and many users say it feels more intuitive initially, especially for building charts without defining a full model.
Why do companies choose Power BI over Tableau?
Companies often choose Power BI because of cost and ecosystem alignment. It integrates deeply with Microsoft tools and scales well for enterprise reporting. Many teams also adopt it because they already use Microsoft 365, making implementation easier and reducing the need for additional infrastructure.
Why do analysts prefer Tableau over Power BI?
Analysts prefer Tableau for its flexibility and visualization control. Community discussions frequently highlight that Tableau makes complex visuals easier to build, while Power BI may require workarounds. It is often favored in roles focused on exploration, storytelling, and presentation-driven analytics.
Final Verdict: Power BI vs Tableau
Most Power BI vs Tableau comparisons focus on features, pricing, or ease of use. In practice, the decision is less about what each tool can do and more about how they behave once usage scales.
Power BI is designed around structure. It works well when teams need consistent reporting, centralized models, and tight integration with existing systems. Tableau is designed around flexibility. It allows faster exploration, deeper customization, and more control over how insights are presented.
Neither approach is inherently better, but both introduce trade-offs. Power BI can become harder to manage as models grow, while Tableau can become harder to standardize as dashboards multiply.
As highlighted throughout this analysis , both tools eventually face similar challenges: maintaining data consistency, managing performance, and supporting evolving business needs.
The key difference is how those challenges show up.
Choosing between them ultimately comes down to how your team prefers to work, whether you prioritize structured consistency or flexible exploration, and which trade-offs you are better equipped to manage over time.


