
What Is an Ad Hoc Query? Definition, Examples & Use
Learn what an ad hoc query is, how it works, real examples, and why businesses use ad hoc analysis to make faster, smarter decisions.


Introduction
Most business intelligence systems are built around predefined dashboards and recurring reports. These tools are great for tracking known metrics such as monthly revenue, active users, or churn rate. But real business decisions rarely come only from known questions.
In reality, teams often face unexpected situations. A sudden drop in conversions. A spike in support tickets. A campaign that performed well in one region but poorly in another. These moments demand immediate answers.
This is where ad hoc analysis becomes critical.
Instead of waiting for a new report to be created, users can directly explore data and shape it around the question they are trying to answer. Ad hoc queries allow teams to move faster, think deeper, and make informed decisions without being limited by fixed dashboards.
In simple terms, an ad hoc query is a custom data request created to answer a specific, unplanned business question.
What Is an Ad Hoc Query? A Better Way to Explore and Understand Your Data
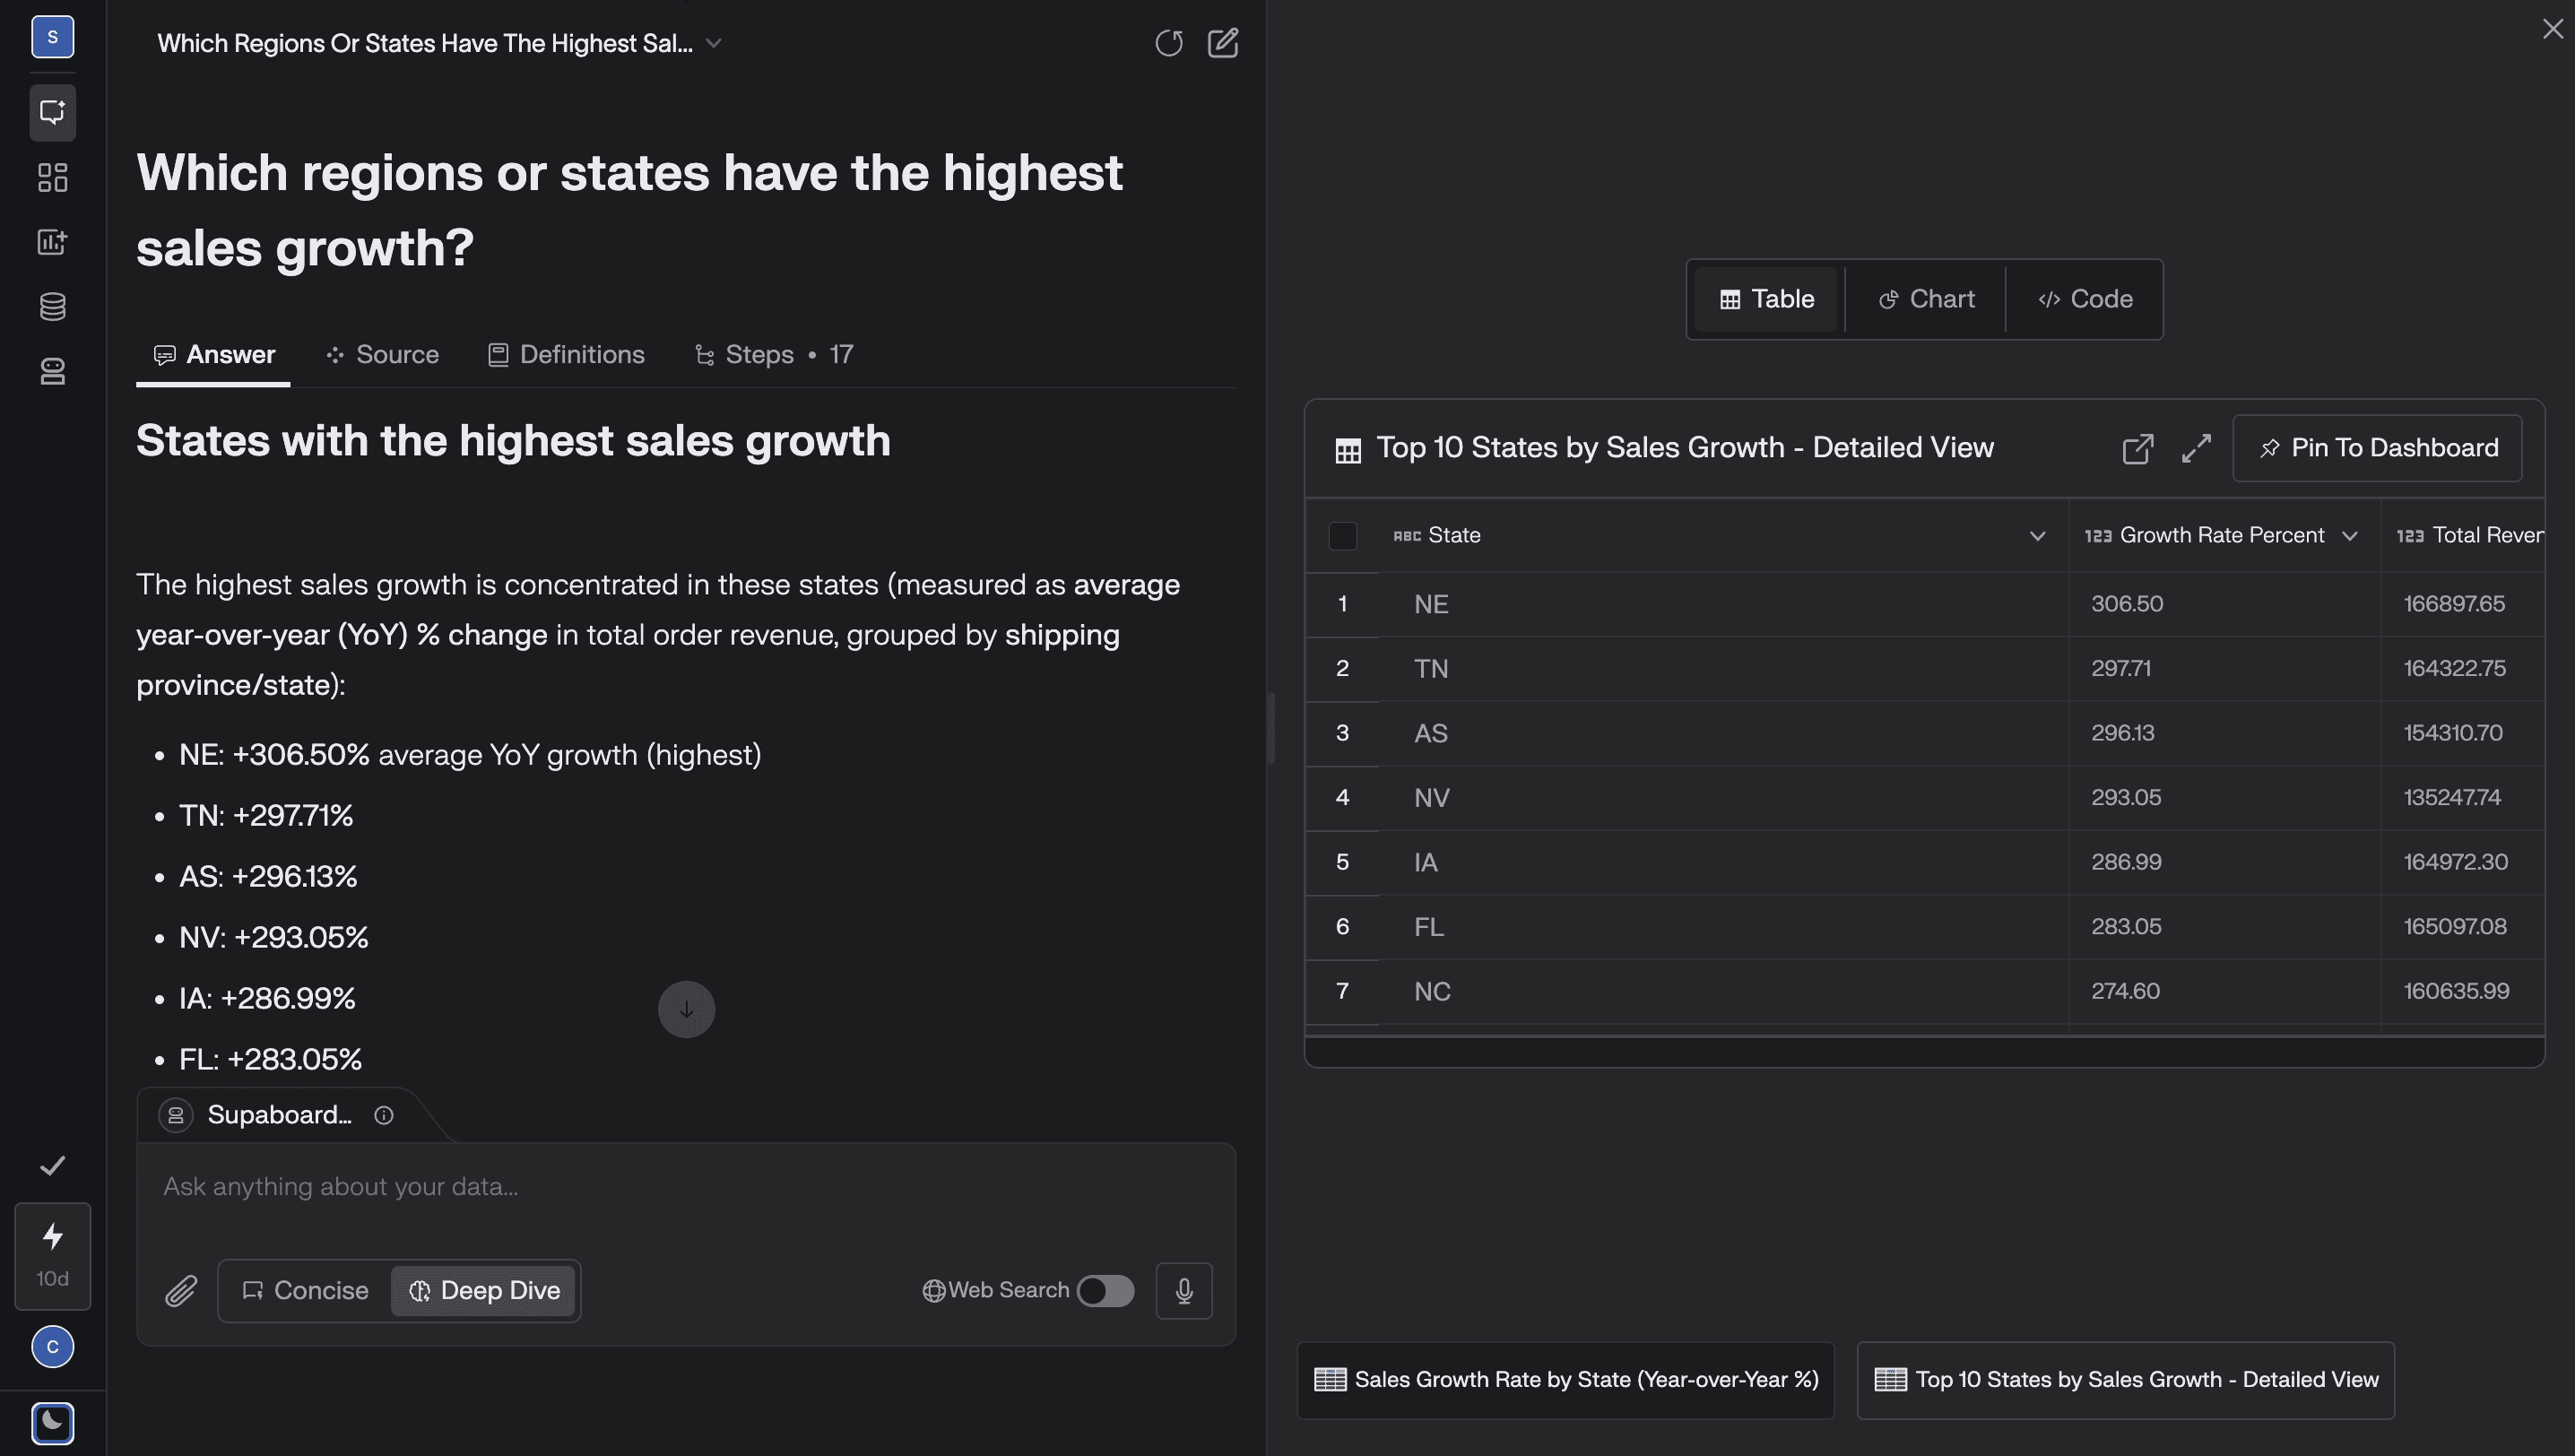
An ad hoc query is a way to ask new questions from your data whenever you need answers. Unlike regular reports that are built once and reused, ad hoc queries are created on the spot, usually when something unexpected happens, like a sudden drop in sales or unusual user behavior.
Normally, with dashboards, you’re limited to what someone else designed. If the question isn’t covered, you have to wait for the data team. That delays decisions and slows down the business.
Ad hoc queries fix this. Instead of waiting, you can dig into your data yourself. Apply filters, compare metrics, and get the answers you need in real time.
See below image for a better explanation:
What Makes a Query Truly Ad Hoc?
An ad hoc query is not just any random question. It has a few key characteristics that make it different from regular reports and dashboards.
1. It’s made for a specific question
Ad hoc queries are created when a new question comes up. For example, if sales suddenly drop in one region, you might want to know why. This type of question was not planned in advance, so you create a fresh query just to answer it.
2. It’s not tied to recurring reports
Unlike weekly or monthly reports, ad hoc queries are not meant to run again and again. They exist to solve a one-time or short-term problem. Once the question is answered, the query may never be used again.
3. It’s exploratory, not fixed
Ad hoc queries help you explore your data. You might start with one question, but as you see results, new questions appear. This back-and-forth exploration is what helps you discover hidden patterns and unexpected insights.
4. It changes as you learn more
With ad hoc queries, nothing is final. You can add new filters, remove columns, change date ranges, or group data differently. The query evolves as your understanding improves.
5. It lets you filter, group, and compare freely
You are not locked into a predefined format. You can slice data by region, product, customer type, or time. You can compare trends side by side and dig deeper into any number that looks unusual.
In practice, ad hoc queries allow BI teams to investigate problems, test assumptions, and take action quickly. Instead of waiting for a new report to be built, teams can find answers immediately and make faster, smarter decisions.
Meaning of Ad Hoc in Business and Data
The term ad hoc comes from Latin and means “for this specific purpose.” In business, it refers to something created to solve a particular problem at a particular time, instead of something that runs regularly on a fixed schedule.
In analytics, ad hoc data analysis is used when teams need quick, focused answers. It is not about long-term tracking. It is about understanding what is happening right now and why.
Example
Imagine your company usually tracks monthly sales through a dashboard. One day, you notice that sales suddenly dropped yesterday in one region.
Your dashboard does not explain why.
So you run an ad hoc query to check:
Which products were affected
Which customer segment stopped buying
Whether prices changed
Whether inventory was low
This one-time investigation is ad hoc analysis. You created it just to answer this specific question, not for regular reporting.
These kinds of questions are not meant for permanent dashboards. They need flexible, temporary, and investigative analysis. That is exactly what ad hoc queries are designed for.
Gartner: Self-Service Analytics Drives Faster Business Decisions
Source: Gartner
Summary:
Gartner highlights how organizations that adopt self-service analytics enable business users to perform ad hoc queries without relying on data teams. This shift reduces reporting bottlenecks and accelerates decision-making, especially when teams need answers to unexpected questions that dashboards cannot cover.Key Insight:
Gartner predicts that business users will produce more ad hoc analysis than data scientists, driven by intuitive BI tools that support on-demand querying.
How Ad Hoc Queries Work
The process of running an ad hoc query is simple, but extremely powerful. It is designed around speed, flexibility, and continuous exploration. Instead of following a fixed reporting structure, users move step by step based on what they discover.
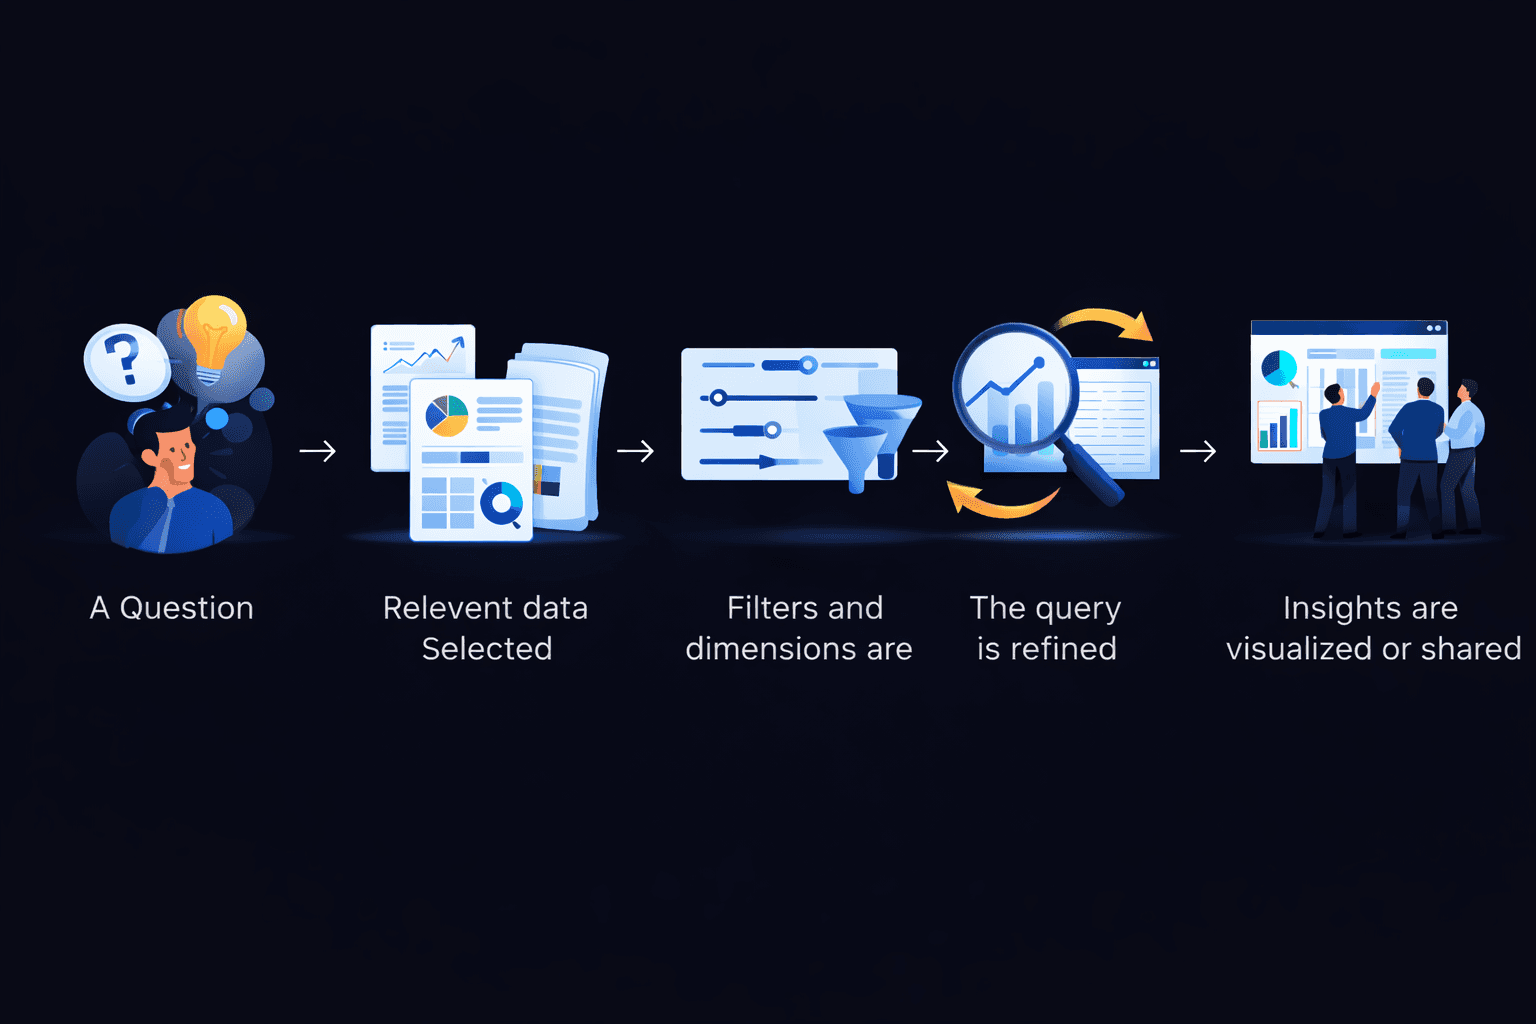
1. A question emerges
Everything starts with a question. A user notices something unusual or needs a specific answer. For example, sales suddenly dropped for one product category, or customer churn increased after a new feature release.
This type of question is usually unplanned, which is why regular dashboards often cannot answer it.
2. Relevant data is selected
Next, the user chooses the datasets, tables, or metrics that are most relevant to the question. This might include sales data, customer behavior, marketing performance, or operational logs.
The goal here is to bring only the necessary data into focus, instead of scanning through everything.
3. Filters and dimensions are applied
Now the data is narrowed down. Users apply filters like time range, region, product type, or customer segment. They can also group data by different dimensions to spot patterns.
This step helps reduce noise and makes insights easier to see.
4. The query is refined
This is where real exploration happens. Users look at the results and ask new questions. They might add another filter, change the grouping, or compare different time periods.
This process often repeats multiple times until the real reason behind a trend or issue becomes clear.
5. Insights are visualized or shared
Once users find something meaningful, they can turn it into a chart, a table, or a temporary report. These insights can then be shared with teammates or stakeholders for quick decision-making.
This fast feedback loop is what makes ad hoc querying so powerful. Instead of waiting days for new reports, users can move from question to insight in minutes.
Ad Hoc Query vs Reports and Analysis
Feature | Ad Hoc Query | Standard Reports |
|---|---|---|
Purpose | Answer specific questions | Monitor known metrics |
Structure | Flexible | Fixed |
Timing | On demand | Scheduled |
Customization | High | Low |
Longevity | Often temporary | Long-term |
Standard reports are designed for consistency. They help track performance over time.
Ad hoc queries exist to explain what reports cannot. They are used when something unexpected happens and teams need to understand why.
Strong BI teams use both. Reports show what is happening. Ad hoc queries explain why it is happening.
Ad Hoc Query Examples
Ad hoc queries are most useful when teams need to investigate something unexpected or dig deeper into what dashboards cannot explain. Below are some real-world examples across different business functions.
Marketing
Marketing teams often need quick answers when performance suddenly changes.
Which campaign drove traffic but failed to convert?
This helps identify whether the problem is with the audience, the landing page, or the offer itself.How did engagement change after a landing page redesign?
Instead of waiting for weekly reports, marketers can instantly compare before-and-after performance.Which audience segments responded best to a new offer?
This helps refine targeting and personalize future campaigns.
These questions are rarely planned in advance. They usually appear after something unexpected happens.
Sales
Sales teams use ad hoc queries to understand deal behavior and revenue movement.
Which deals stalled after a pricing update?
This can reveal whether pricing is becoming a barrier for certain customer types.How do win rates differ by region or industry?
This helps sales leaders optimize territory planning and messaging.Which product bundles close the fastest?
Useful for designing better sales packages and promotions.
These insights often change week to week, so fixed dashboards are not enough.
Finance
Finance teams rely on ad hoc queries when something does not look right.
Why did cloud costs spike last month?
This could be due to increased usage, inefficiencies, or billing issues.Which departments exceeded their budgets unexpectedly?
Helps in early detection of overspending.How does actual spending compare to forecast for a specific project?
This is often a one-time investigation, not a recurring report.
Product
Product teams use ad hoc analysis to understand how users behave.
Which features correlate with higher retention?
Helps prioritize what to build and improve.Where do users drop off during onboarding?
This can reveal UX or usability issues.How did behavior change after a new release?
Helps validate whether the update had the intended impact.
Each of these questions requires flexibility. They cannot be answered using a single static dashboard because the filters, groupings, and comparisons change every time.
This is exactly why ad hoc data analysis is so important. It gives teams the freedom to explore, investigate, and adapt, without waiting for new reports to be built.
Ad Hoc Query vs Ad Hoc Analysis
An ad hoc query and ad hoc analysis are closely related, but they are not the same thing.
An ad hoc query is a single, on-demand question asked of the data. It focuses on retrieving specific information, such as filtering, grouping, or comparing values to answer one immediate business question.
Ad hoc analysis, on the other hand, is the broader investigative process. It usually involves running multiple ad hoc queries, exploring different angles, adjusting filters, and testing assumptions until the root cause of a trend or issue becomes clear.
In simple terms:
Ad hoc query = one question
Ad hoc analysis = the exploration process using many questions
For example, if revenue drops unexpectedly, an ad hoc query might show which product category declined. Ad hoc analysis would continue by checking regions, customer segments, pricing changes, and user behavior to fully understand why the drop occurred.
Both are essential. Ad hoc queries provide the building blocks, while ad hoc analysis turns those answers into actionable insights.
Ad Hoc Query Tools and Use Cases
Not all BI systems support true ad hoc querying. Many are built for fixed dashboards, not for free exploration. A good ad hoc setup lets users move quickly from a question to an answer without waiting for new reports.
Example
A sales dashboard shows revenue dropped yesterday. It does not explain why.
So you run an ad hoc query to check:
Which region was affected
Which products dropped
Whether traffic or conversion changed
This quick investigation is ad hoc analysis.
Real-World Use Case
A SaaS team notices a sudden increase in churn. Instead of waiting for a new report, they run ad hoc queries to find which users churned, when it started, and what changed before it happened. They identify the issue within minutes and take action.
Ad hoc queries are most useful for fast investigations, product analysis, customer behavior checks, and one-off business questions.
Some modern BI platforms, including Supaboard, are designed around this idea of interactive, question-driven analysis rather than fixed reporting.
Benefits and Limitations of Ad Hoc Queries
Benefits
• Faster answers to unexpected questions
When something unusual happens, like a sudden dip in sales or a spike in traffic, ad hoc queries let teams investigate immediately instead of waiting for a new report to be built.
• Greater independence for business users
Both technical and non-technical users can explore data on their own, without depending on analysts or engineers for every small request. This removes bottlenecks, encourages collaboration, and speeds up decision-making across teams.
• Encourages deeper, exploratory analysis
Instead of sticking to predefined views, users can follow their curiosity, test assumptions, and uncover patterns that fixed dashboards often fail to surface.
• Reduces pressure on data teams
Data teams can focus on building strong data models and infrastructure, rather than spending time on repetitive, one-off questions.
Limitations
• Results may lack consistency
Different users may analyze the same data in different ways, which can create multiple versions of the truth if definitions and metrics are not standardized.
• Poorly framed questions can mislead
If the wrong filters, time ranges, or metrics are used, the insight may appear correct but actually tell the wrong story.
• Performance can suffer on large datasets
Complex, real-time queries can slow down systems when working with massive or poorly optimized data.
FAQs About Ad Hoc Queries
What is an ad hoc query in simple terms?
An ad hoc query is a custom data question created on the spot to solve a specific problem. Unlike regular reports, it is not pre-built or scheduled. It helps users explore data immediately when something unexpected or unclear needs explanation.
What are ad hoc queries used for?
Ad hoc queries are used for quick investigation, validation, and exploration. Teams rely on them when they notice unusual trends, sudden drops, or spikes in performance and need fast answers without waiting for new dashboards or reports.
Are ad hoc queries the same as SQL queries?
No. SQL is just one way to create ad hoc queries. Many modern BI tools let users build them visually using filters, charts, and drag-and-drop interfaces. SQL is optional and mostly used by advanced or technical users.
What is an example of ad hoc analysis?
A common example of ad hoc analysis is investigating why churn suddenly increased for one customer segment after a pricing update. This type of analysis is temporary, exploratory, and focused on understanding a specific situation.
What are ad hoc queries?
Ad hoc queries are on-demand data queries created to answer specific, unplanned questions that are not covered by predefined reports or dashboards. They allow users to explore data freely by applying filters, grouping dimensions, and comparing metrics in real time. Ad hoc queries are commonly used in business intelligence to investigate unexpected trends, validate assumptions, and uncover insights quickly without waiting for new reports to be built.
Can non-technical users run ad hoc queries?
Yes. Most modern BI platforms support self-service ad hoc querying, allowing both technical and non-technical users to explore data using simple interfaces. Users can filter, group, and compare data without writing code or relying on analysts.
Know more about top BI tools.
Conclusion
In today’s fast-moving businesses, waiting for predefined reports slows decisions. Ad hoc queries allow teams to ask questions the moment they arise and explore data without limitations. When combined with ad hoc analysis, they help uncover the real reasons behind changes in performance, user behavior, or revenue. Instead of being restricted by static dashboards, teams gain the freedom to investigate and act quickly.
Explore how Supaboard enables fast, flexible ad hoc analysis and smarter business decisions.


