Business intelligence (BI) tools are now essential for organizations that want to make decisions based on data. Modern BI platforms allow users to analyze large datasets, create visualizations, and uncover meaningful insights that support both strategic and operational goals.
This comparison looks at Supaboard vs Tableau, two tools offering different approaches to analytics. As the demand for faster, AI-driven insights continues to grow, many teams are also actively searching for tableau competitors and modern Tableau alternatives, making this comparison more relevant than ever.
What is Supaboard?
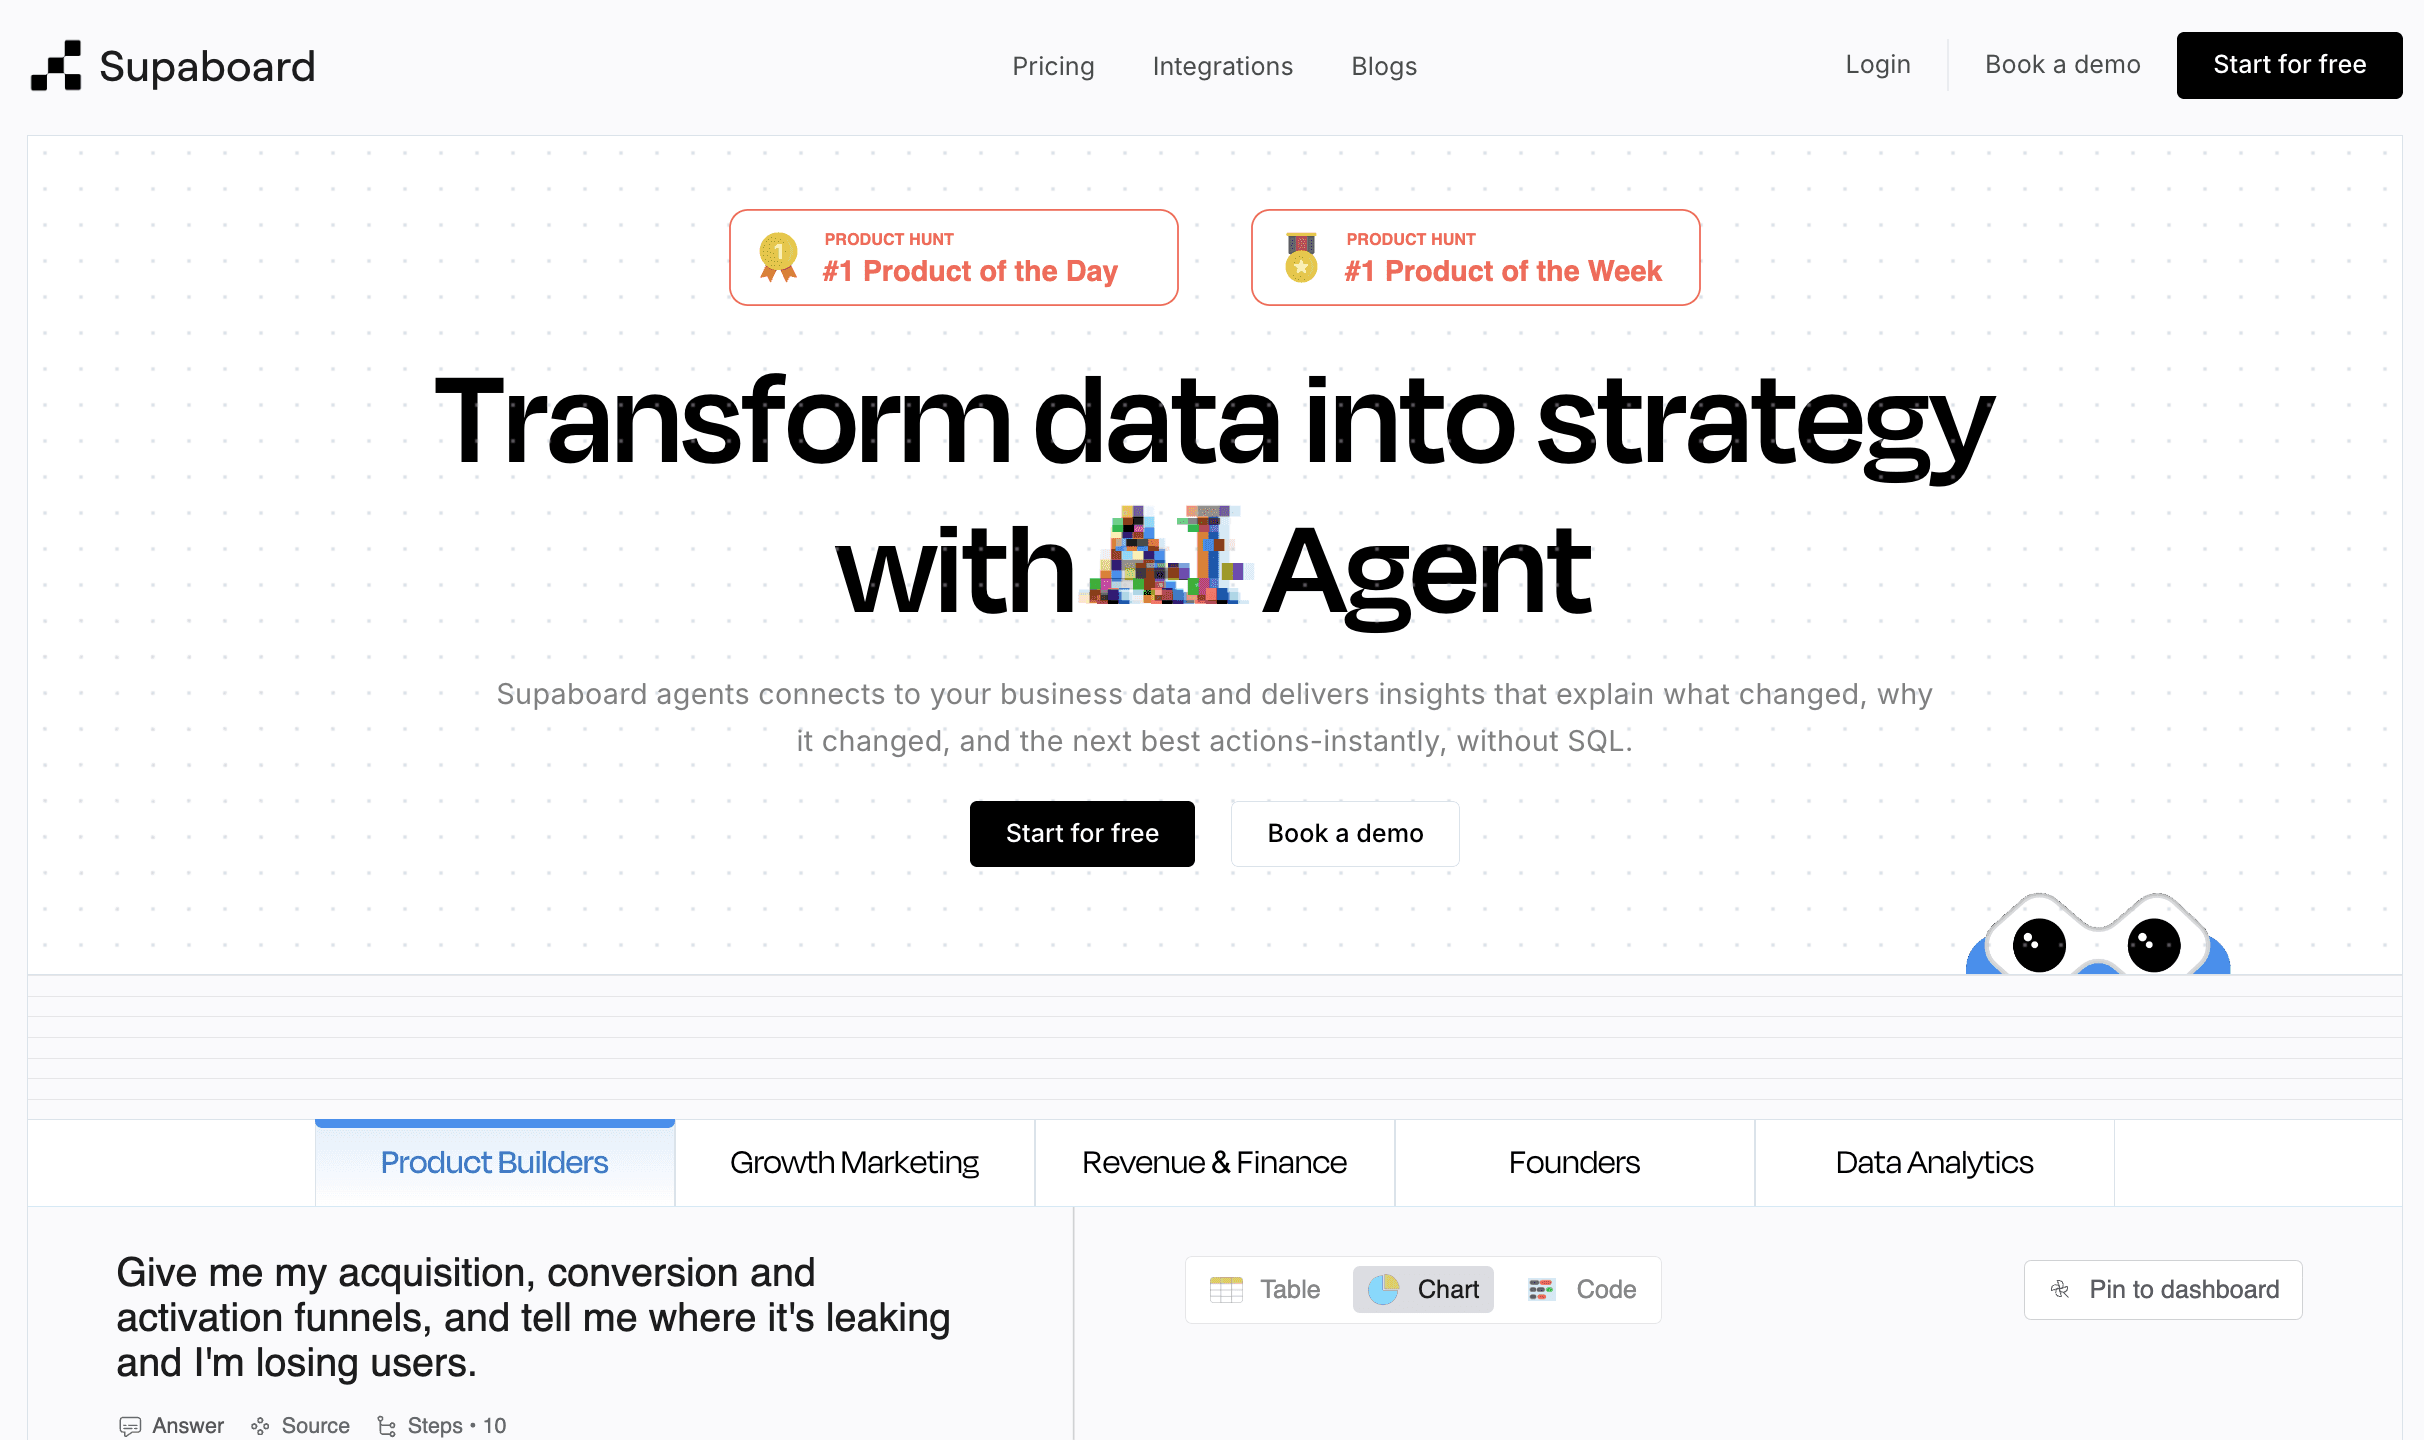
Supaboard is a modern, AI-powered business intelligence platform designed for teams that want fast insights without the need for technical complexity. It unifies data from multiple sources and automatically transforms it into clear dashboards, visualizations, and metrics.
Unlike traditional BI tools that require SQL or manual setup, Supaboard focuses on accessibility and instant insights. Users ask questions in natural language, explore trends instantly, and build dashboards without writing code, positioning Supaboard as a strong Tableau alternative for businesses seeking speed.
Features of Supaboard
Ask AI: Get insights using natural language, no SQL required.
600+ Integrations: Connect SaaS, marketing, sales, finance, product finance, and data tools easily.
Instant Dashboards: Convert raw data into charts and dashboards instantly.
Query Builder: Create custom logic visually without coding.
Stella AI (2 Smart Modes):
Concise: Quick answers for “what happened” questions.
Deep Dive: Deeper analysis to explain “why it happened” or “How it happened.”
Embedded Analytics: Add dashboards inside your app or portal.
Interactive Dashboards: Enterprise-grade visuals for all teams.
Collaboration Tools: Comments, sharing, team access, and permissions.
Cost Efficient: Scales without heavy IT setup.
Secure & Compliant: Robust permissions and governance.
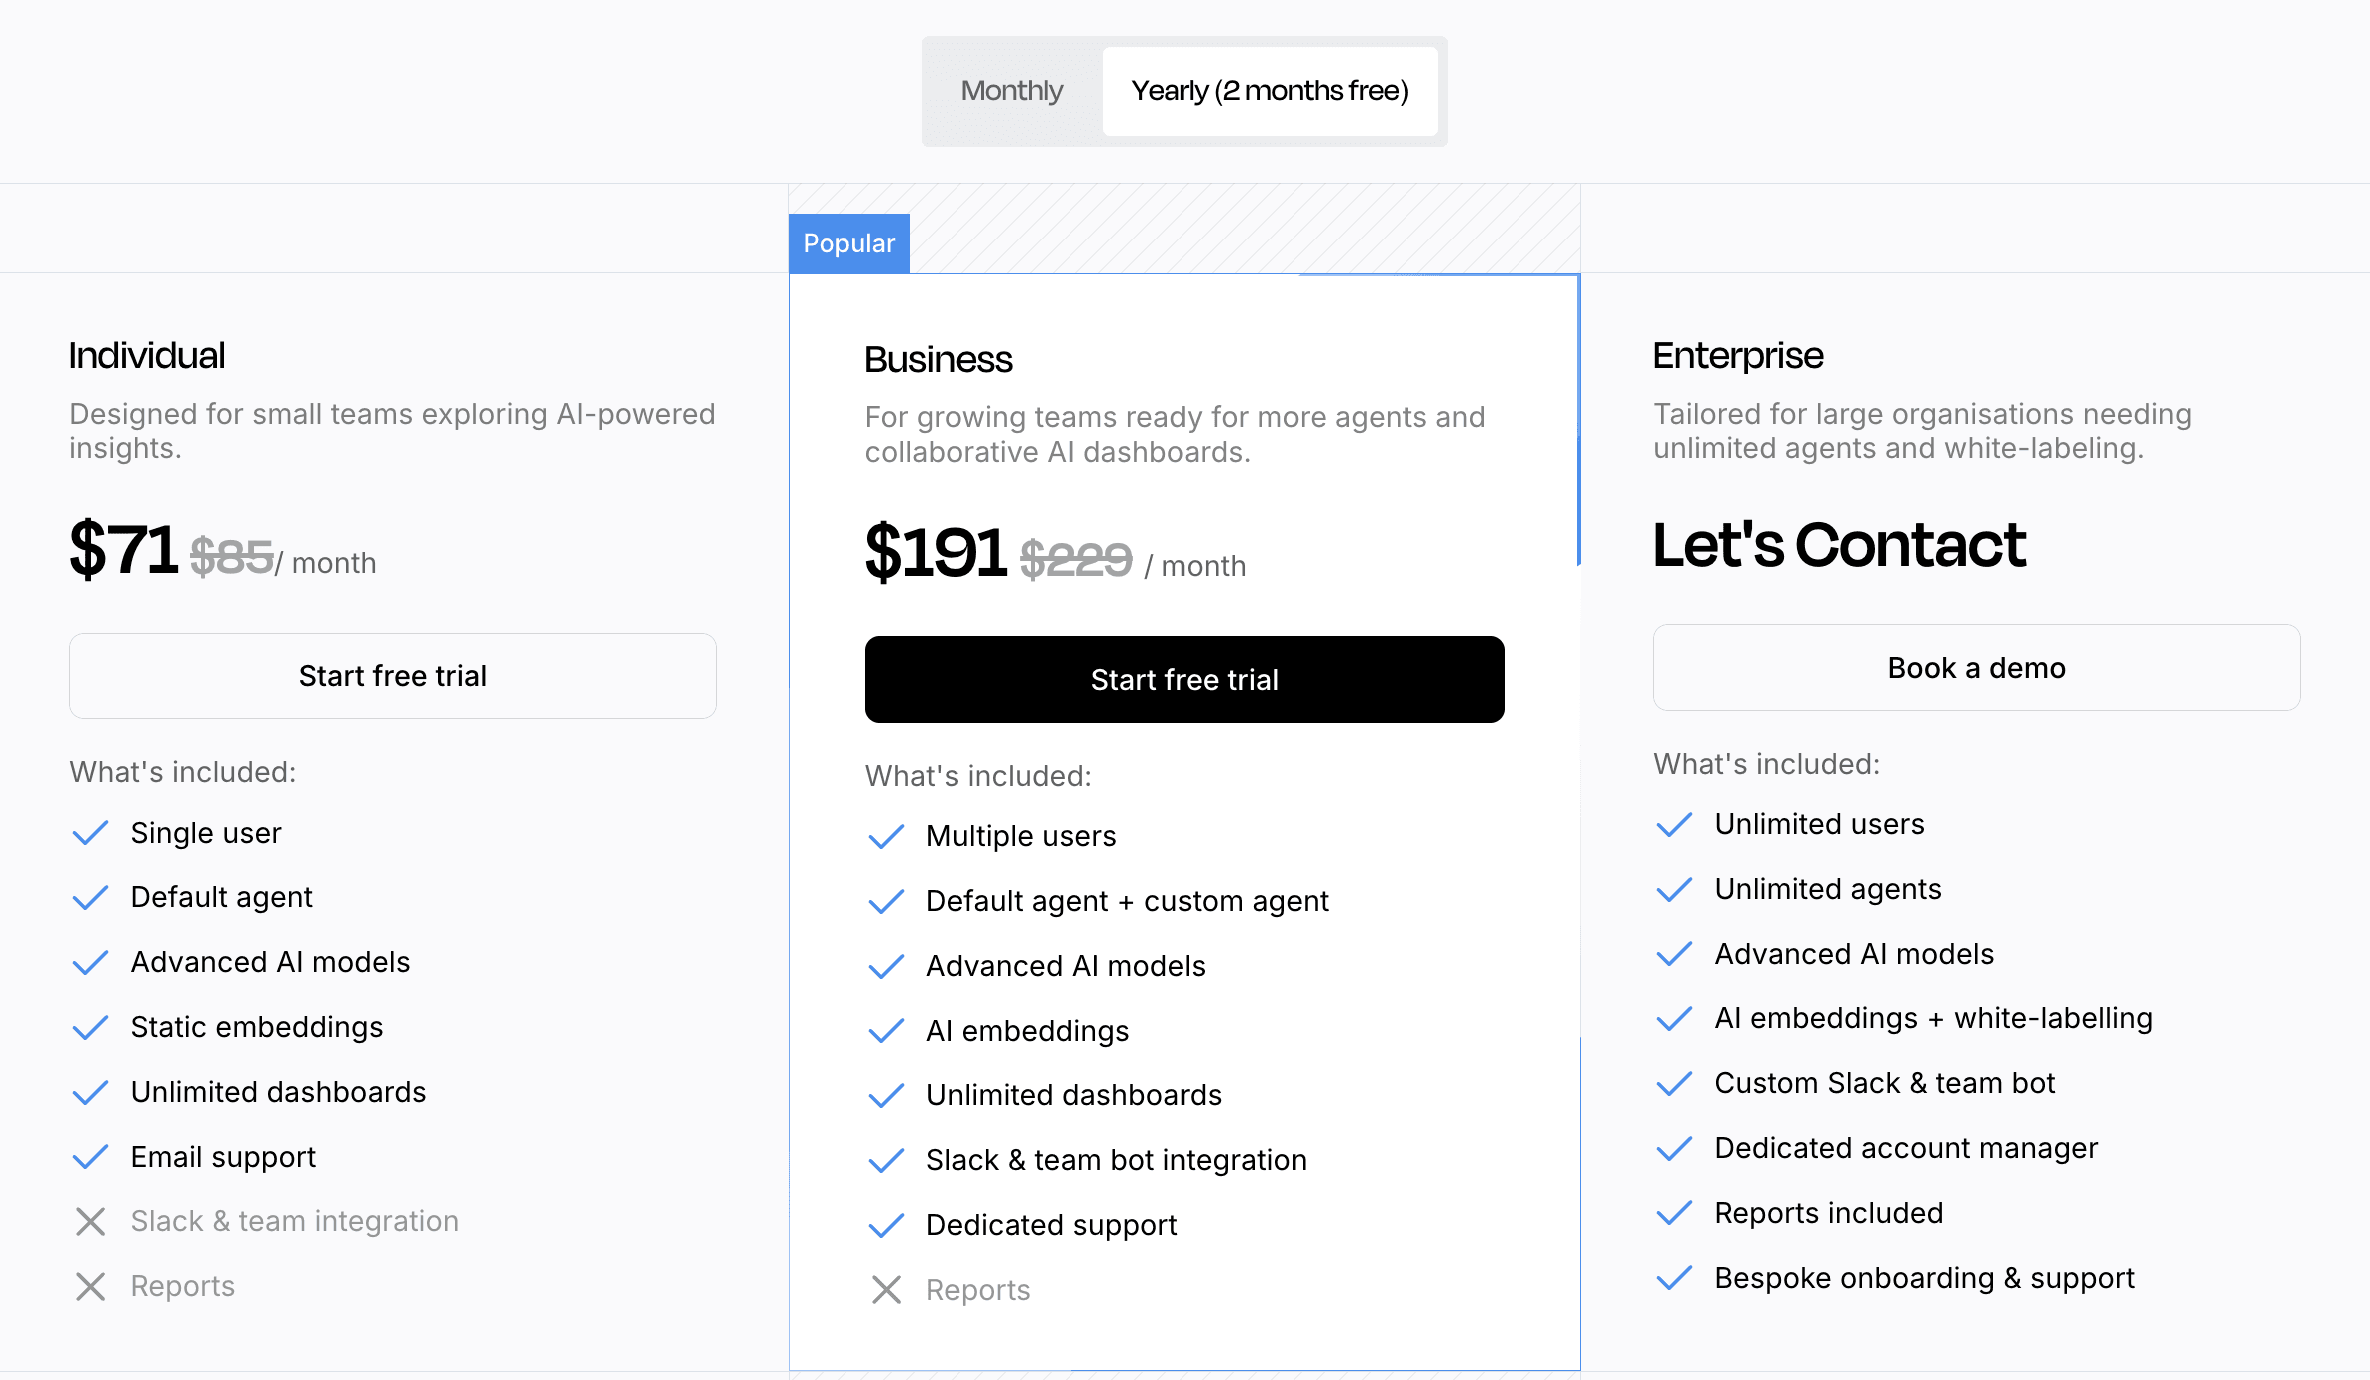
Supaboard Pricing
Supaboard offers Starter, Pro, and Enterprise plans designed for teams of all sizes. You can compare all features and limits here: View Supaboard Pricing
Supaboard Testimonials
“Switching to Supaboard changed how our entire team works with data. For the first time, marketing, sales, and operations could explore insights without waiting on analysts. The AI suggestions alone saved us hours every week.”
— Product Lead, SaaS Company
What is Tableau?
Tableau is a powerful and user-friendly Business Intelligence (BI) and data visualization tool that helps people turn raw data into clear charts, graphs, and interactive dashboards. It allows both technical and non-technical users to easily analyze data, spot trends, and make informed business decisions, all using simple drag-and-drop features and connections to many data sources.
Features of Tableau
Drag-and-drop visualization building
Interactive dashboards for real-time data exploration
Strong support for data connections across spreadsheets, databases, and cloud platforms
Advanced chart types, maps, and analytical visuals
Options for live data connections and scheduled refreshes
Data blending and joining capabilities
Predictive analytics and built-in AI features (Ask Data, Explain Data)
High-performance processing for large datasets
Mobile-friendly dashboards
Collaboration through Tableau Server or Tableau Cloud
Tableau Pricing
Tableau offers role-based pricing with Creator, Explorer, and Viewer plans, designed for teams of all sizes to scale efficiently: Tableau Pricing
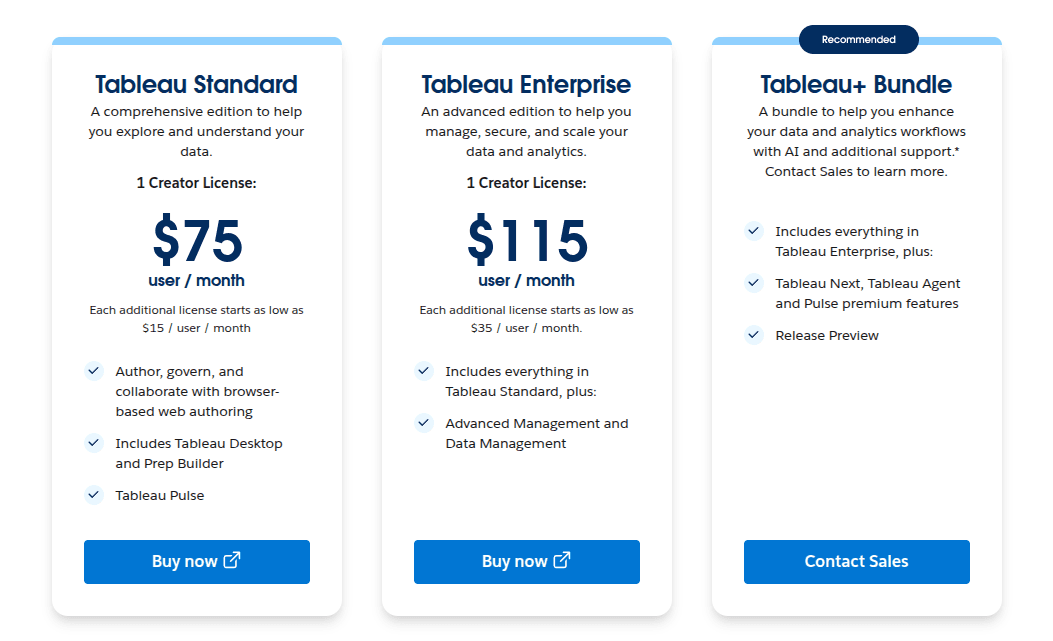
Tableau Testimonials
“Before Tableau, reporting took days. Now our leadership gets real-time dashboards they can explore on their own. It changed the pace of our entire workflow.”
— BI Director, Finance Firm
What’s the Difference Between Supaboard and Tableau
Supaboard and Tableau are both tools for analyzing and visualizing data, but they are built with different approaches in mind. Understanding these differences helps you choose the tool that fits your team’s needs and workflow.
1. Approach to Data Analysis
Supaboard: Focuses on simplicity and speed. It uses AI to help users ask questions in natural language and get insights quickly. This reduces the need for technical skills.
Tableau: Focuses on detailed, customizable visual analysis. It gives users full control to design dashboards, charts, and complex visuals manually.
2. Ease of Use
Supaboard: Easier for Tech and non-technical teams. Most tasks happen automatically or through AI guidance.
Tableau: Requires more learning. Users need to understand how to connect data, build visualizations, and structure dashboards.
3. Setup and Workflow
Supaboard: Designed for fast onboarding. Dashboards generate quickly, and insights appear with minimal setup.
Tableau: Takes more time to build and maintain. It’s ideal for teams that need highly structured reporting or complex data work.
4. Type of Users
Supaboard: Works well for teams that want quick answers, simple dashboards, and AI support without relying on analysts.
Tableau: Fits teams that have analysts or BI experts who can design detailed dashboards and work with complex datasets.
5. Customization & Flexibility
Supaboard: Offers essential visualizations, guided analysis, and automated insights.
Tableau: Offers deep customization with advanced charts, calculations, and design options.
6. Cost & Resources
Supaboard: Requires fewer technical resources and tends to be easier to maintain.
Tableau: Often needs more technical support, infrastructure, and training, especially in larger organizations.
In Simple Terms
Supaboard is built for teams who want quick, simple, AI-supported insights without technical complexity.
Tableau is built for teams who need advanced, detailed visualizations and have the people/resources to manage them.
Both tools are useful; the right choice depends on your team’s skills, your data needs, and how much complexity you want to manage.
Supaboard vs Tableau: Comparison Table
Category | Supaboard | Tableau |
Overall Approach | AI-assisted exploration and automated dashboards | Manual, highly customizable visual analysis |
Ease of Use | Lower learning curve | Higher learning curve |
Dashboard Creation | Automatic + manual editing | Fully manual design |
AI Features | Natural-language queries and guided analysis | Built-in AI, mainly assisting manual workflows |
Data Connections | Broad SaaS/tool integrations | Strong enterprise and database integrations |
Customization | Suitable for most standard needs | Very high customization |
Setup | Quick onboarding | Requires more setup and maintenance |
Best For | Teams needing fast, simple insights | Teams needing advanced, detailed reporting |
Learning Curve | Easier for non-technical users | Best for experienced analysts |
Collaboration | In-app comments and permissions | Collaboration via Tableau Server/Cloud |
What Makes Supaboard a Good Choice Compared to Tableau?
Supaboard is often preferred by teams that:
Want fast insights without technical overhead
Need natural-language exploration
Prefer automated dashboards
Have varying levels of technical skill across the team
Require broad no-code integrations with SaaS and business tools
Want a modern Tableau alternative with simpler setup
When Might Tableau Be a Better Fit Than Supaboard?
Tableau is typically a stronger choice for teams that:
Require deep, highly customized visualizations
Have dedicated BI or analytics professionals
Need advanced modeling or integration with Python/R
Rely on enterprise-level reporting standards
Want full control over dashboard design and structure
Read here for: Best Tableau Alternatives& Competitors
Frequently Asked Questions (FAQ)
What’s the differences in pricing between Supaboard and Tableau?
Tableau uses a role-based pricing model, starting at $75 per user/month for Standard and $115 per user/month for Enterprise, with additional user licenses costing extra.
Supaboard uses a plan-based pricing model, starting at $85/month for Starter and $229/month for Pro, with custom pricing for Enterprise. Supaboard includes unlimited dashboards and AI research time in its plans
Do I need technical skills to use Supaboard or Tableau?
There’s no right or wrong answer here; Supaboard is easy for both technical and non-technical users, while Tableau can require more technical skills for complex dashboard building.
What are the best Tableau competitors?
Some of the most popular Tableau competitors include Supaboard, Microsoft Power BI, Qlik, Looker, Domo, Sigma Computing, and Metabase. Each of these tools offers different strengths, such as AI-powered insights, easier setup, embedded analytics, or lower pricing.
Can BI tools replace manual reporting?
For most teams, yes. Modern BI automates dashboards, updates data in real time, and reduces reliance on spreadsheets saving hours of manual reporting work every week.
Which Tableau competitors are best for non-technical users?
Tools like Supaboard, Power BI, and Looker Studio are popular among non-technical users due to their intuitive interfaces and guided analytics features.
Are Tableau competitors suitable for enterprises?
Yes, many Tableau competitors are enterprise-ready, offering features like role-based access, governance, compliance, and scalability.