
Types of Analytics Explained: Descriptive, Diagnostic, Predictive & Prescriptive
Learn the four types of analytics; descriptive, diagnostic, predictive, and prescriptive, with real examples and practical use cases for smarter decisions.


Introduction: Why Analytics Fails More Often Than It Succeeds
We have seen it countless times: companies spend thousands on dashboards, BI tools, and analytics software, yet still make intuition-based decisions. Teams stare at numbers all day, but the insights rarely translate into action. Why? Because they’re using the wrong type of analytics for the question at hand.
Data alone doesn’t make you smarter. Using the right kind of analytics in the right situation does. Some analytics tell you what happened, some explain why, some predict the future, and a few tell you exactly what action to take. Understanding the difference can save millions in wasted effort, lost opportunities, and avoidable mistakes.
The Four Types of Analytics: A Practical Framework
Here’s the framework I follow when advising businesses:
Descriptive Analytics – What happened?
See the story your data is already telling.Diagnostic Analytics – Why did it happen?
Dig deeper to find the real cause behind results.Predictive Analytics – What is likely to happen next?
Use past patterns to anticipate the future.Prescriptive Analytics – What should we do about it?
Decide on actions that maximize impact while minimizing risk.
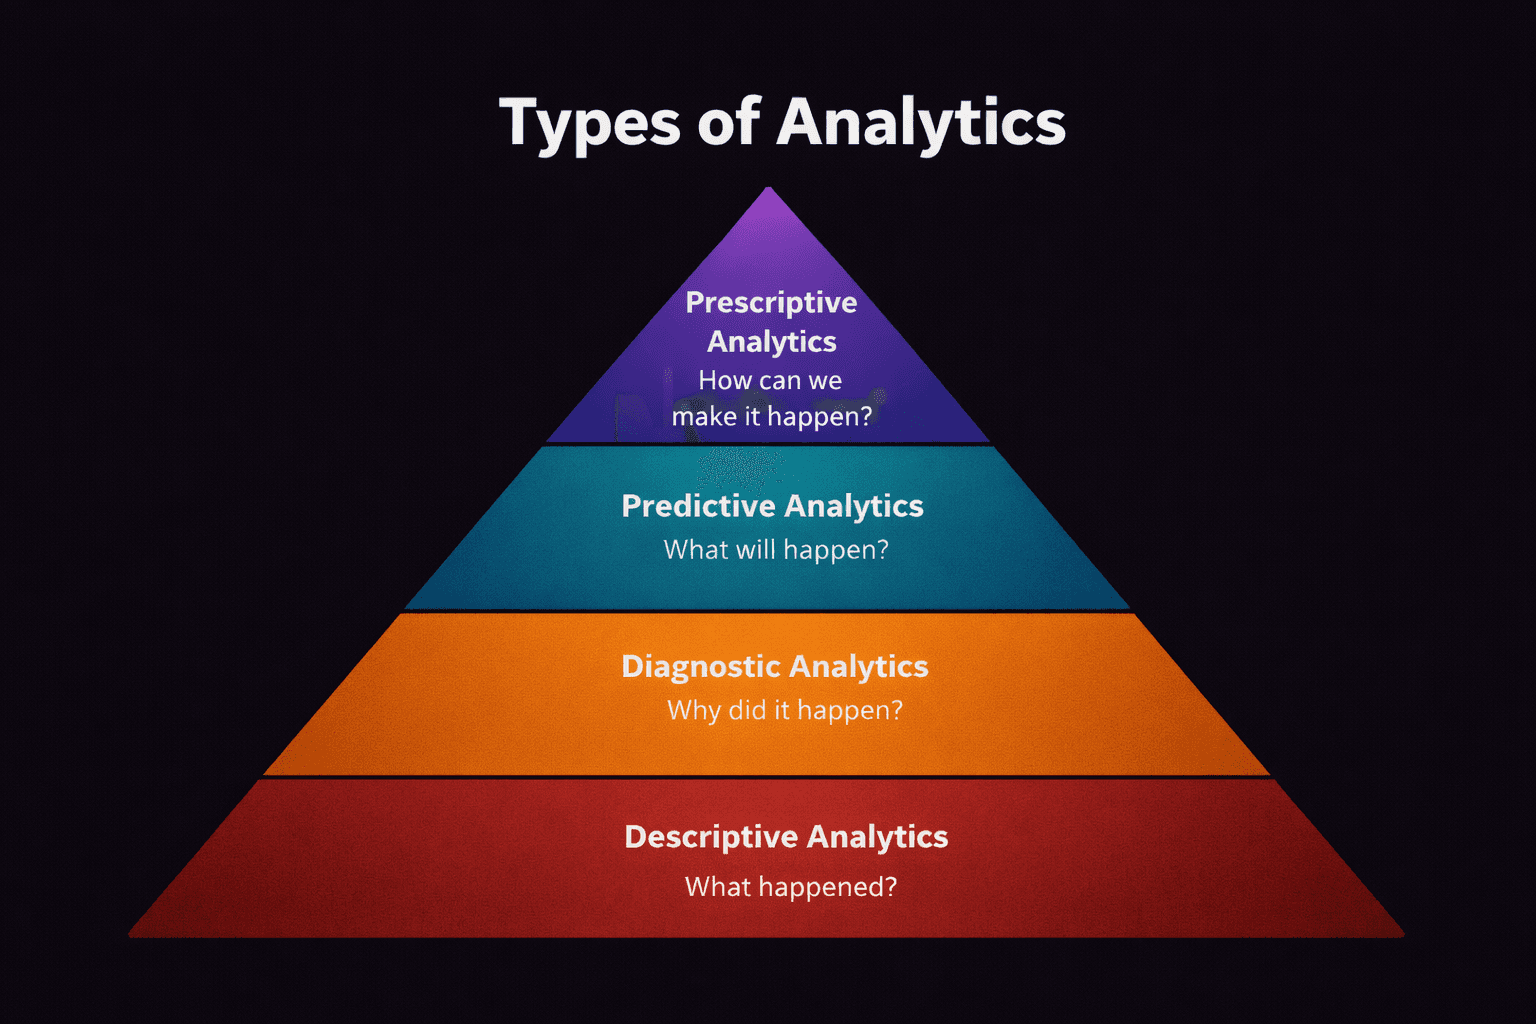
Each builds on the previous, and skipping steps is where most teams fail.
When to Use Each Type Which Analytics?
Descriptive Analytics: When you need clarity on the past.
Scenario: “I just got the monthly report. Sales are down 10%, but which products or channels caused it?” Descriptive analytics answers that.
Diagnostic Analytics: When you need to understand the why.
Scenario: “Conversions dropped after our last email campaign. Why?” This type tells you it wasn’t the campaign, but a broken checkout page.
Predictive Analytics: When the future matters.
Scenario: “I need to stock products for the holiday season. Which will sell and which won’t?” Predictive analytics helps forecast demand so you don’t overstock, or run out.
Prescriptive Analytics: When decisions are complex or high-stakes.
Scenario: “We have 10,000 delivery routes and 50 drivers, what’s the most efficient plan?” Prescriptive analytics gives an optimized answer, factoring constraints like time, traffic, and cost.
Descriptive Analytics: Telling the Story of the Past
What is Descriptive Analytics?
Descriptive analytics summarizes historical data and presents it in easy-to-understand formats like reports, charts, and dashboards. Its main goal is to show past performance, highlight trends, and track key metrics so decision-makers can quickly understand what is happening in the business, without technical complexity.
In simple words: Descriptive analytics helps enterprise businesses clearly see what has already happened in their operations.
How Descriptive Analytics Works?
Collect data from sales, marketing, or operations.
Clean and organize it.
Calculate key metrics.
Visualize trends with dashboards and reports.
Real Example:
A retail chain noticed weekend sales were higher than weekdays. Using this insight, they adjusted staff schedules and ran targeted weekend promotions—improving efficiency and revenue.
Why Descriptive analytics Matters?
Descriptive analytics gives your team a shared understanding. Everyone—from C-suite to operations, sees the same numbers, reducing confusion and aligning efforts.
Tools & Tips:
Tools: Supaboard, Power BI, Tableau, Looker
Tip: Focus on meaningful KPIs and avoid dashboard clutter. Automate reports but regularly check data quality.
Diagnostic Analytics: Finding the Root Cause
What is Diagnostic Analytics?
Diagnostic analytics looks deeper into data to understand why something happened. It goes beyond surface-level reports and examines relationships, patterns, and behaviors to uncover the real reasons behind performance changes.
In simple words: Diagnostic analytics helps enterprise businesses understand the real cause behind a problem or result.
How Diagnostic Analytics Works?
Compare different time periods
Break data into segments (users, regions, products)
Analyze patterns and correlations
Drill down into details to find the root cause
Real Example:
A SaaS company saw a spike in churn. Diagnostic analysis revealed it was tied to a pricing change for a small but vocal segment, not overall product dissatisfaction. Fixing this targeted segment prevented larger losses.
Why diagnostic analytics Matters?
Without diagnostic analytics, teams guess, misallocate resources, or fix the wrong problem. It ensures you’re addressing the real cause, not a symptom.
Tools & Tips:
Tools: SQL, Supaboard, Power BI, Excel
Tip: Ask focused questions, validate correlations, and combine insights with domain knowledge.
Predictive Analytics: Seeing the Future Before It Happens
What is Predictive Analytics?
Predictive analytics uses past data to estimate what is likely to happen in the future. It identifies patterns and trends, then uses them to forecast possible outcomes. These predictions are not guarantees, but they help businesses prepare better.
In simple words: Predictive analytics helps enterprise businesses prepare for the future before it arrives.
How Predictive Analytics Works:
Collect large amounts of historical data
Identify patterns and trends
Apply statistical or machine learning models
Generate future forecasts and probabilities
Real Example:
An e-commerce company predicted high demand for certain products before the festive season. They stocked early, avoided shortages, and increased sales.
Why Predictive Analytics Matters?
Predictive analytics allows businesses to act early instead of reacting late. It reduces uncertainty and supports better planning.Tools & Tips:
Tools: Python, R, AutoML platforms, Supaboard
Tip: Ensure data quality, monitor model accuracy, retrain regularly, and combine AI insights with human judgment.
Prescriptive Analytics: Telling You What to Do
What is Prescriptive Analytics?
Prescriptive analytics tells you what action to take after analyzing data and future predictions. Instead of just showing what might happen, it suggests the best option based on your goals, limits, and risks. This helps teams make faster, smarter, and more confident decisions.
In simple words: Prescriptive analytics tells enterprise businesses what they should do next.
How Prescriptive Analytics Works?
Prescriptive systems simulate multiple scenarios and evaluate each option using optimization techniques, business rules, and AI-based models. They account for limitations such as budget, time, workforce, and regulations before making recommendations.
Prescriptive analytics Example:
A logistics company uses prescriptive analytics to determine the most cost-effective delivery routes. The system evaluates distance, fuel cost, traffic, and deadlines to suggest the best routes
Why Prescriptive analytics Matters?
Prescriptive analytics helps organizations make faster, smarter, and more consistent decisions. It reduces human bias, improves efficiency, and enables large-scale decision-making.
Tools & Tips:
Tools: Optimization engines, AI platforms, decision intelligence tools
These systems can evaluate thousands of options in seconds.
Best Practices: Start small, test recommendations, keep humans in the loop, and monitor ethical impact.
Common Mistakes When Using Analytics
1. Using Past Data to Predict the Future
Many teams think that if something worked before, it will work again. But customer behavior, markets, and trends change. Old data alone cannot tell you what will happen next.
2. Confusing Correlation with Causation
Just because two things happen together doesn’t mean one caused the other. This mistake leads to wrong conclusions and wrong decisions.
3. Trusting Data Without Understanding Context
Numbers don’t tell the full story. If you don’t understand the business context behind the data, you can easily misinterpret what it actually means.
4. Collecting Too Much Data, Using Too Little
Many companies track hundreds of metrics but don’t act on any of them. More data doesn’t mean better decisions clear data does.
Want to Avoid These Mistakes?
Tools alone don’t fix analytics problems, clarity does. Platforms like Supaboard help teams move beyond confusing dashboards and turn insights into real actions.
If you want analytics that actually drive decisions (not just reports), Supaboard is built for that.
Try Supaboard and start making data-driven decisions that actually work.
Quick Comparison
Type | Key Question | Purpose | Real-Life Example |
|---|---|---|---|
Descriptive | What happened? | Summarize past performance | Weekend sales trends |
Diagnostic | Why did it happen? | Identify root cause | Churn spike after pricing change |
Predictive | What might happen? | Forecast future outcomes | Holiday product demand forecast |
Prescriptive | What should we do? | Recommend actions | Optimize 10,000 delivery routes |
What is the Analytics as a Service (AaaS) business model?
The Analytics as a Service (AaaS) business model is a cloud-based solution where businesses access data analytics tools, infrastructure, and expertise through a subscription. It eliminates the need for in-house systems, enabling companies to generate insights, run analytics, and scale operations cost-effectively using third-party platforms.
Conclusion
Analytics is more than dashboards or AI tools. Used correctly, it’s a decision-making engine.
Descriptive shows the past.
Diagnostic explains the why.
Predictive anticipates the future.
Prescriptive tells you the best action.
Teams that understand which type to use, and when move faster, avoid costly mistakes, and gain a sustainable competitive edge.


