
Best AI-Powered BI Tools in 2026: Features, Pricing & Real Comparison
Explore the top AI BI tools in 2026 with real comparisons, pricing, and insights. Find the right business intelligence platform for faster, smarter decisions.


Introduction: Why Most BI Comparisons Fail (And What This One Does Differently)
If you want to choose the right AI-powered BI tool, you need more than feature lists.
In 2026, business intelligence is changing fast. The best BI tools now use AI to help teams explore data, find insights, and make decisions faster, without relying on analysts for every question.
Whether you're a data team, founder, or business user, this guide compares the top AI BI tools and shows what actually works in real use.
Key Takeaways (Quick Summary)
Supaboard: AI-driven insights, visuals, and analysis with strong self-service BI capabilities
Power BI: Budget-friendly and great for Microsoft users, needs DAX for deeper analysis
Tableau: Powerful visuals and analysis, harder to learn and expensive at scale
Qlik Sense: Strong for flexible data exploration, though pricing and setup can get complex
ThoughtSpot: Easy search-based analytics, but works best with well-prepared data and high budgets
Looker: Reliable for governance and modeling, but requires technical setup (LookML)
Domo: All-in-one platform with strong mobile support, but costs grow with more users
Sisense: Ideal for embedded and custom analytics, but more suited for technical teams
Quick Comparison (Real-World View)
Tool | Strengths | Weaknesses | Starting Cost |
Supaboard | AI-driven insights, visuals & analysis, strong self-service BI, fast setup | Newer platform, smaller ecosystem vs legacy tools | ~$71/month |
Power BI | Affordable, deep Microsoft integration (Excel, Azure), widely adopted | Requires DAX for advanced use, performance drops with large/complex datasets | ~$14/user/month |
Tableau | Best-in-class visualizations, flexible dashboards, strong community | Expensive at scale, steep learning curve for non-analysts | ~$70/user/month |
Qlik Sense | Powerful data exploration (associative engine), good for complex analysis | Pricing is confusing, setup and data modeling can be heavy | ~$200/month (varies) |
ThoughtSpot | Natural language search, fast querying on structured data, business-user friendly | Requires well-modeled/clean data, high enterprise pricing | ~$100K/year (enterprise) |
Looker | Strong governance, centralized metrics layer, great for BigQuery users | Requires LookML (technical), slower iteration for ad-hoc analysis | Custom pricing |
Domo | End-to-end platform (data + dashboards), strong mobile experience | Costs increase quickly with users, less flexible for deep modeling | ~$750/user/year |
Sisense | Strong for embedded analytics, customizable, API-first approach | Technical setup, expensive for smaller teams | ~$40K+/year |
AI-Powered BI Tools Comparison: Features, Pricing, and Strengths (2026)
1. Supaboard
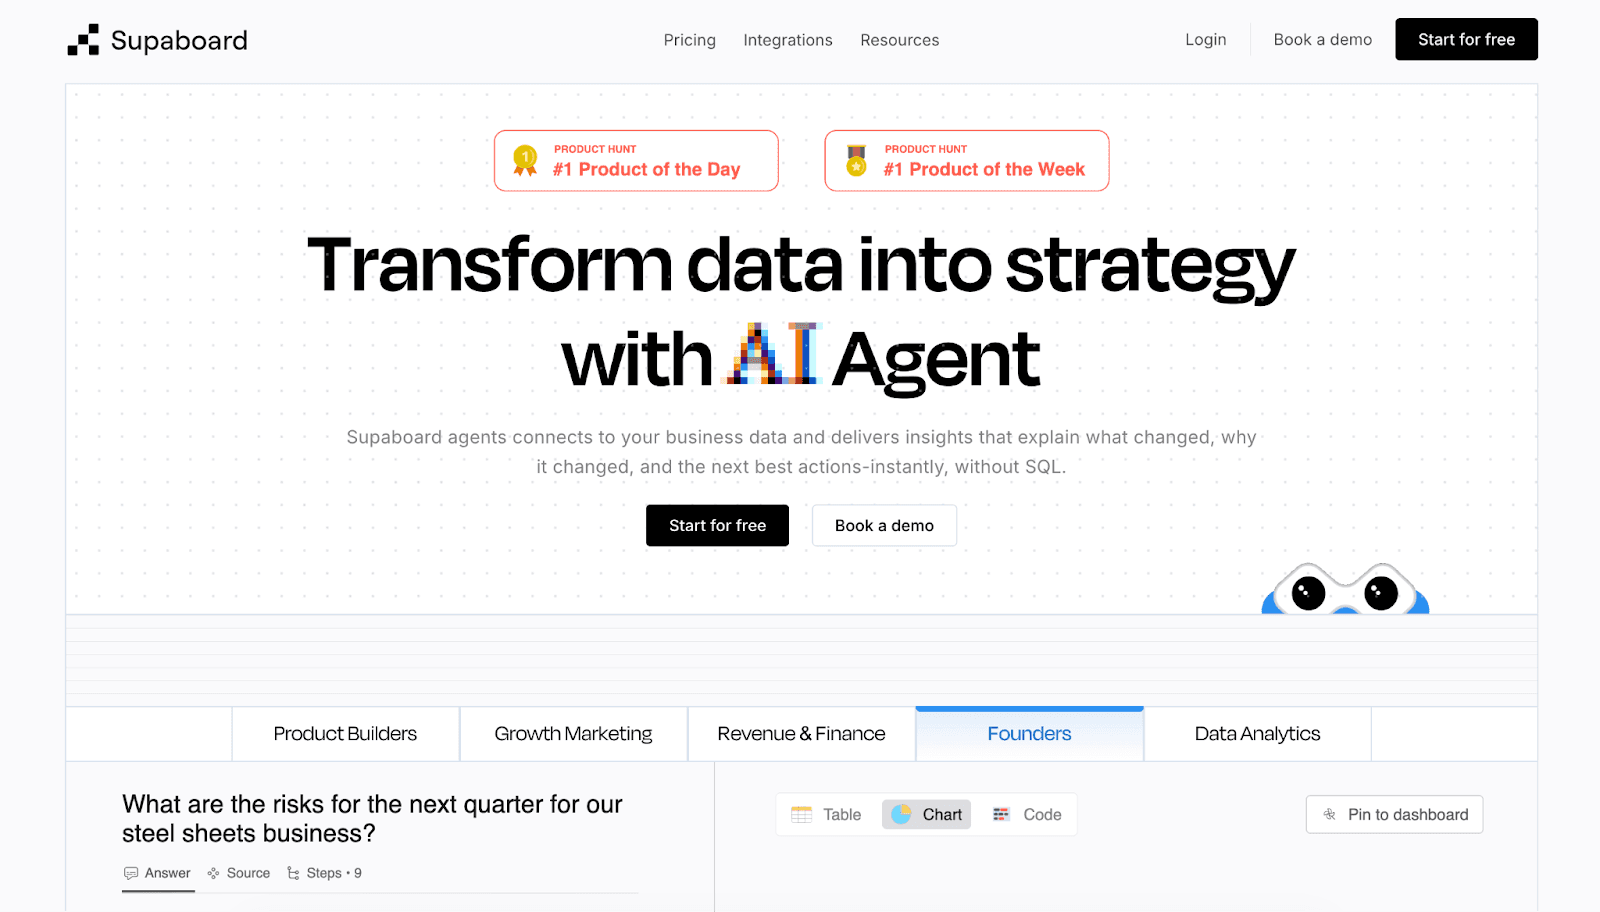
Supaboard is a modern AI-powered BI tool built for teams that want fast insights without heavy setup. Instead of depending only on dashboards, it focuses on helping users explore data using AI, generate visuals instantly, and understand business metrics quickly. It is designed for startups and growing teams that want self-service analytics without relying too much on analysts.
Features of Supaboard
Supaboard focuses on AI-driven insights, visuals, and analysis, making it easy for users to work with data without technical knowledge. You can ask questions in natural language and instantly get dashboards, charts, and reports. It also supports self-service BI, a shared metrics layer, and fast data exploration. This makes it useful for teams that want quick answers instead of building complex dashboards from scratch.
Pricing of Supaboard
Supaboard Pricing follows a simple pricing model starting around $71/month. Unlike many traditional BI tools, it does not depend heavily on per-user pricing. This makes it easier for teams to scale without worrying about cost increasing every time a new user is added.
Strength of Supaboard
The main strength of Supaboard is speed and simplicity. It reduces the time between asking a question and getting an insight. Even non-technical users can explore data easily, which improves adoption across teams and helps businesses make faster decisions.
2. Microsoft Power BI
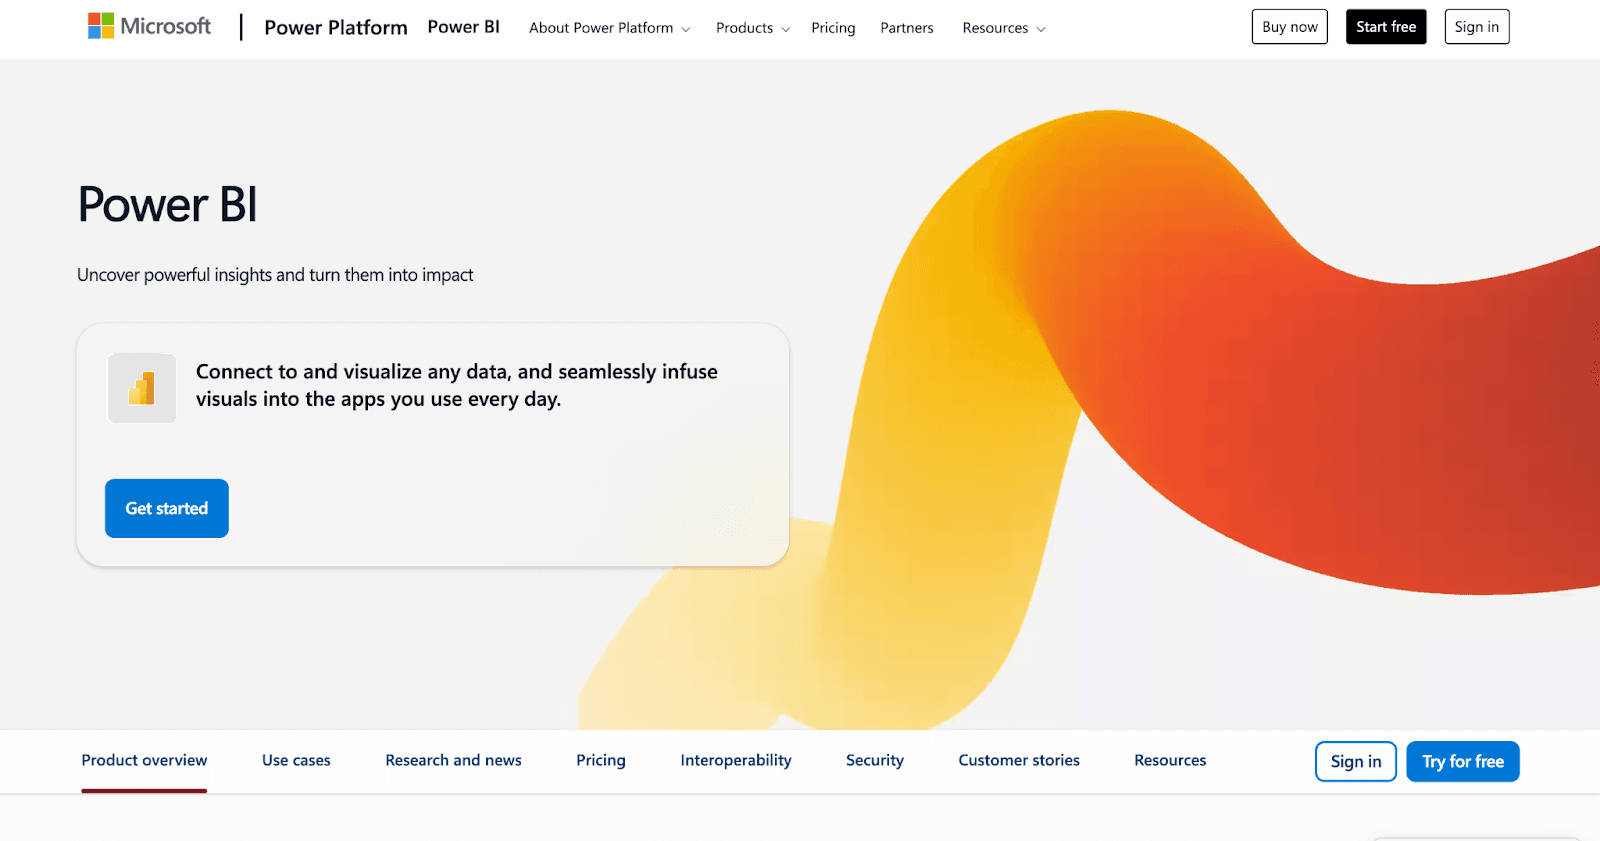
Microsoft Power BI is one of the most popular business intelligence tools used across companies. It is especially strong for organizations already using Microsoft products like Excel, Azure, and Teams. It combines dashboards, reporting, and analytics into one platform and is widely adopted because of its affordability and ease of use.
Features of Power BI
Power BI offers dashboards, data modeling, and AI-powered analytics. It integrates deeply with Microsoft tools, allowing users to work smoothly across Excel, Azure, and other services. It also supports real-time dashboards and AI features like Copilot for generating visuals and insights quickly . This makes it a strong AI-powered BI platform for reporting and operational analytics.
Pricing of Power BI
Power BI Pricing is known for its affordable pricing. It starts at around $14 per user/month, with higher plans available for enterprise use . Many teams start with the basic plan and upgrade as their data needs grow.
Strength of Power BI
The biggest strength of Power BI is its cost and ecosystem integration. It works very well with Microsoft tools and is easy to start with. However, advanced usage often requires DAX, which can make it harder for non-technical users.
3. Tableau
Tableau is a leading data visualization and business intelligence tool known for its strong visual analytics capabilities. It is widely used by analysts and enterprises that need detailed insights and interactive dashboards. Tableau is especially popular for storytelling with data and presenting insights clearly to stakeholders.
Features of Tableau
Tableau provides advanced visualizations, drag-and-drop dashboards, and interactive analytics. It supports AI-powered features that help users generate insights and analyze data faster . It is one of the best tools for visual analytics in BI, allowing users to explore large datasets and create detailed reports with flexibility.
Pricing of Tableau
Tableau pricing starts around $70 per user/month, with different tiers like Viewer, Explorer, and Creator plans . The cost increases based on features and team size, making it more expensive at scale.
Strength of Tableau
Tableau’s biggest strength is its powerful visualization capabilities. It allows deep analysis and flexible dashboard creation. However, it has a steeper learning curve and requires some training to fully use its features.
4. Qlik Sense
Qlik Sense is a self-service BI tool designed for flexible data exploration. It uses an associative data model, which allows users to explore relationships across datasets without predefined queries. It is commonly used by organizations that need deeper analysis and flexible reporting.
Features of Qlik Sense
Qlik Sense offers interactive dashboards, self-service analytics, and predictive modeling. Its associative engine allows users to explore data freely, unlike traditional BI tools that depend on fixed dashboards. This makes it useful for data discovery and advanced analytics workflows, especially when working with complex datasets.
Pricing of Qlik Sense
Qlik Sense pricing starts around $200/month, but it can vary depending on deployment and usage. The pricing model can feel complex, especially for teams that are scaling or using enterprise features.
Strength of Qlik Sense
The main strength of Qlik Sense is flexibility. Users can explore data in multiple ways without limitations. However, setup and pricing complexity can be challenging, especially for smaller teams.
5. ThoughtSpot
ThoughtSpot is an AI-powered analytics platform focused on search-based data exploration. Instead of building dashboards, users can simply ask questions and get answers instantly. It is designed mainly for business users who want quick insights without technical effort.
Features of ThoughtSpot
ThoughtSpot provides natural language search, real-time analytics, and AI-driven recommendations. Users can directly query data and get visual outputs without creating dashboards. This makes it one of the leading AI BI tools for search-based analytics, especially for teams that want fast answers.
Pricing of ThoughtSpot
ThoughtSpot Pricing is typically priced for enterprise use, starting at around $100K/year. The pricing depends on scale, usage, and deployment, making it less suitable for small teams.
Strength of ThoughtSpot
Its biggest strength is ease of use. Business users can quickly get answers without writing queries. However, it requires clean and well-structured data to work effectively.
6. Looker
Looker is a modern business intelligence platform owned by Google, mainly used for data modeling and governance. It is popular among companies using Google Cloud and BigQuery, where maintaining consistent metrics across teams is important.
Features of Looker
Looker uses LookML for data modeling and provides a centralized semantic layer. It supports dashboards, reporting, and governance, making it ideal for enterprise BI workflows. It ensures that all teams use the same definitions for metrics and data.
Pricing of Looker
Looker price follows custom pricing, depending on usage, data size, and deployment. This makes it flexible but less transparent compared to fixed pricing tools.
Strength of Looker
The main strength of Looker is governance and consistency. It helps teams maintain a single source of truth. However, it requires technical expertise and is slower for quick, ad-hoc analysis.
7. Domo
Domo is an all-in-one BI platform that combines data integration, dashboards, and analytics in one place. It is designed for companies that want a complete solution without using multiple tools for different workflows.
Features of Domo
Domo offers dashboards, real-time analytics, and data integration features. It supports mobile-first BI and allows users to monitor data from anywhere. It is useful for end-to-end business intelligence workflows, from data collection to reporting.
Pricing of Domo
Domo pricing starts around $750 per user/year, but costs increase as more users are added. It can become expensive for larger teams.
Strength of Domo
The biggest strength of Domo is that it provides everything in one platform. However, the cost can grow quickly, which may not be ideal for smaller companies.
8. Sisense
Sisense is a developer-focused BI tool known for embedded analytics and customization. It is often used by companies that want to integrate analytics into their own products or platforms.
Features of Sisense
Sisense supports embedded dashboards, APIs, and AI-driven analytics. It allows businesses to build custom analytics experiences inside their applications. This makes it a strong option for embedded BI and custom analytics solutions.
Pricing of Sisense
Sisense pricing usually starts around $40,000/year, depending on scale and customization. It is mainly targeted at enterprise users.
Strength of Sisense
Its biggest strength is flexibility and customization. It allows deep integration into products. However, it requires technical expertise and higher setup effort.
AI-Powered BI Tools Comparison Table (2026)
Tool | Key Features | Weaknesses | Pricing | Ideal User | Best For |
Supaboard | AI-driven insights, visuals & analysis, self-service BI, natural language queries, fast dashboard creation | Newer platform, smaller ecosystem | ~$71/month | Startups, product teams, non-technical users | Fast insights, self-service analytics |
Power BI | Dashboards, data modeling, Microsoft integration, AI features (Copilot), real-time reporting | Requires DAX for advanced use, performance issues with large data | ~$14/user/month | Microsoft-based teams, analysts | Reporting, enterprise dashboards |
Tableau | Advanced visualizations, interactive dashboards, strong analytics, large community | Expensive, steep learning curve | ~$70/user/month | Data analysts, enterprises | Visual analytics, storytelling |
Qlik Sense | Associative data engine, self-service analytics, predictive modeling | Complex pricing, setup heavy | ~$200/month (varies) | Data teams, enterprises | Deep data exploration |
ThoughtSpot | Search-based analytics, natural language queries, real-time insights | Expensive, needs clean data | ~$100K/year | Business users, large enterprises | Search-driven analytics |
Looker | Semantic layer (LookML), strong governance, Google Cloud integration | Requires technical setup, slower iteration | Custom pricing | Data engineers, enterprises | Data governance, modeling |
Domo | All-in-one BI, data pipelines, mobile-first dashboards | Cost increases with users | ~$750/user/year | Mid-large teams | End-to-end BI workflows |
Sisense | Embedded analytics, APIs, customizable dashboards, AI analytics | Technical setup, high cost | ~$40K+/year | Developers, SaaS companies | Embedded BI, custom analytics |
Frequently Asked Questions (FAQs)
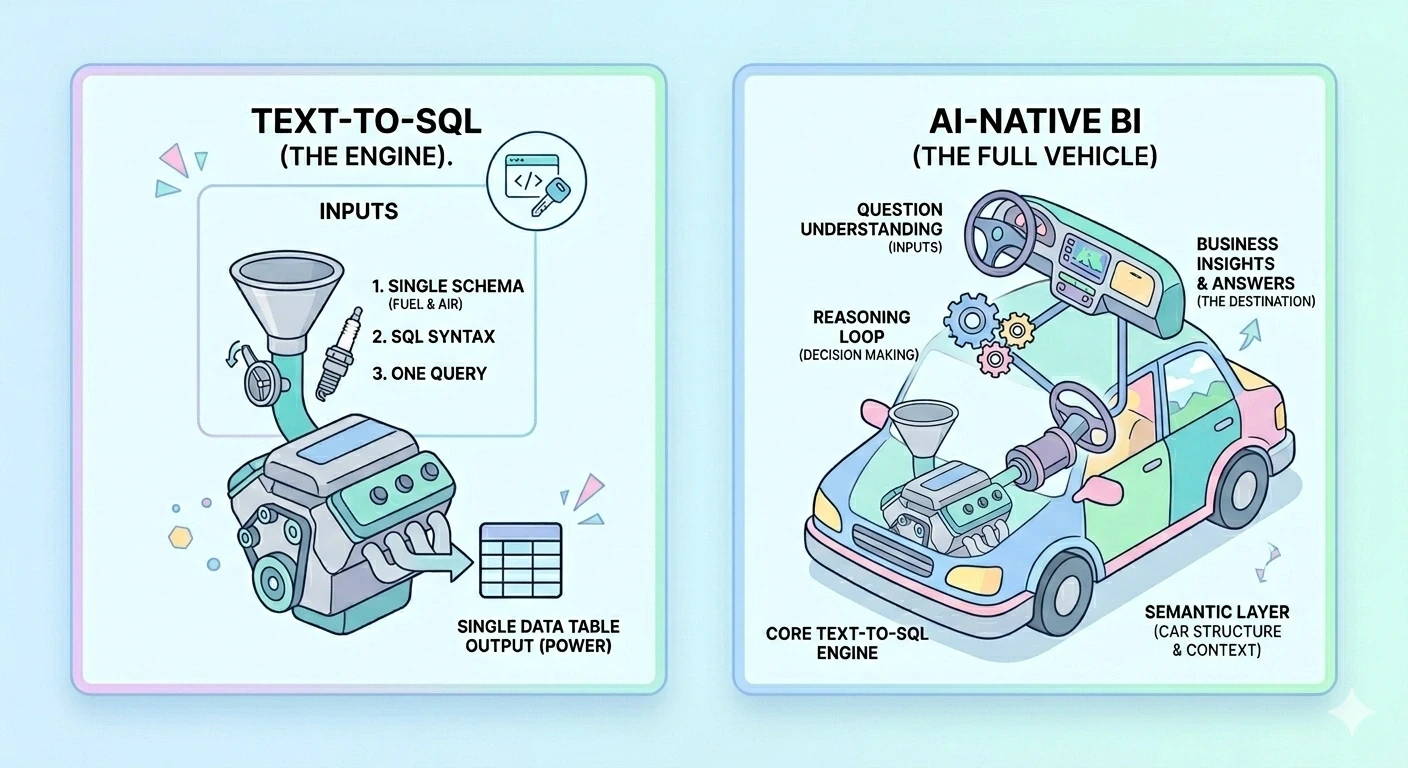
What is an AI-powered BI tool and how is it different from traditional BI?
AI-powered BI tools use machine learning and natural language queries to generate insights automatically. According to IBM’s definition of Business Intelligence, BI helps transform raw data into actionable insights. AI enhances this by reducing manual work and enabling faster decision-making.
Which AI BI tool is best for startups and small teams in 2026?
For startups, tools like Supaboard and Power BI are strong options. Supaboard offers fast setup and self-service analytics, while Power BI is budget-friendly. The best choice depends on whether you prioritize ease of use, cost, or deeper data modeling capabilities.
Are AI BI tools expensive compared to traditional BI platforms?
AI BI tools can vary widely in pricing. Some, like Power BI, are affordable for small teams, while others like ThoughtSpot target enterprise budgets. Many modern tools offer usage-based or flexible pricing, making them more accessible compared to traditional enterprise BI platforms.
Do AI-powered BI tools require coding or technical skills?
Most modern AI BI tools are designed for non-technical users. Features like natural language queries and automated dashboards reduce the need for coding. However, advanced customization or data modeling in tools like Looker or Power BI may still require technical knowledge.
How do AI BI tools improve decision-making for businesses?
AI BI tools speed up decision-making by providing real-time insights, automated analysis, and easy data exploration. Instead of waiting for reports, teams can instantly understand trends, identify issues, and take action, leading to faster and more data-driven business decisions.
What should you look for when choosing an AI BI tool in 2026?
You should evaluate ease of use, AI capabilities, integrations, pricing, scalability, and governance. According to Gartner’s BI platform overview, strong BI platforms combine analytics, reporting, and integration to support better decision-making across teams.
Final Thoughts
If you’re a founder already using business intelligence tools, you’ve likely seen both their value and limitations. In 2026, AI-powered BI tools are shifting analytics from static dashboards to faster, more flexible decision-making systems. Instead of relying heavily on analysts, teams can now use self-service BI to explore data, generate insights, and act quickly. The key is not adding more tools, but choosing a BI platform that reduces friction and improves clarity. The right setup helps your team move from data to decisions faster, making your analytics workflow more efficient, scalable, and aligned with real business needs.
Improve Your Data Decisions with Supaboard
Most teams still don’t have a clear view of what’s actually happening in their data. Insights are delayed, dashboards are outdated, and teams rely too much on analysts.
Supaboard changes this with AI-powered BI, helping your team explore data, generate insights, and build visuals instantly using self-service analytics.
Try Supaboard free for 14 days with your own data and see how quickly your team can go from questions to real insights, without dashboards slowing you down.


