
Logistics Analytics: How Businesses Use Data to Improve Supply Chain Decisions
Learn how logistics analytics helps businesses optimize routes, reduce costs, predict disruptions, and make better supply chain decisions using data.


Introduction: Why Logistics Analytics Has Become a Business Priority
You’ve probably heard stories like this before.
A global logistics company operating in over 200 countries, like DHL, moves millions of shipments every day. A delay at one port, a warehouse bottleneck, or a carrier issue in a single region could disrupt deliveries worldwide. Yet missed deliveries remain the exception, not the norm.
That reliability doesn’t come from reports alone. It’s driven by logistics analytics.
By connecting data across transportation, warehousing, and inventory systems, logistics teams focus on exceptions instead of averages. As this blog shows, modern logistics analytics helps answer urgent why questions, predict disruptions early, and guide real-time decisions across complex, global supply chains.
What Is Logistics Analytics?
Logistics analytics is the practice of analyzing logistics data to improve transportation, inventory, warehousing, and delivery operations. It helps businesses understand what is happening across the supply chain and why issues occur, rather than relying on static reports.
By combining historical and real-time data, logistics analytics supports better decisions such as route optimization, cost control, and service-level improvement. As logistics operations grow more complex, data-driven logistics analytics reduces inefficiencies, lowers costs, and improves overall supply chain performance.
How Data Analytics Is Used in Logistics?
Data analytics in logistics is used to support day-to-day operational decisions, not just long-term reporting. By combining historical data with real-time signals, logistics teams gain visibility into what is happening right now, and why.
In practice, analytics helps teams monitor shipments across routes and carriers, compare planned versus actual delivery performance, and quickly identify exceptions such as delays, cost spikes, or capacity shortfalls. Instead of reviewing averages at the end of the month, teams use analytics to focus on outliers that require immediate action.
Logistics analytics is commonly applied to optimize delivery routes using traffic, weather, and GPS data; improve inventory management by aligning stock levels with demand patterns; and increase warehouse efficiency through better picking, slotting, and labor allocation. It also enhances supply chain visibility by connecting data across transportation, warehousing, and partner systems.
Most importantly, analytics enables prediction. By spotting patterns early, logistics teams can anticipate delays, adjust capacity, and make proactive decisions that protect service levels while controlling costs.
Types of Analytics Used in Logistics
Modern logistics analytics uses different types of analytics to help teams make better decisions about cost, speed, and service, from understanding past performance to choosing the right action in real time.
Descriptive Analytics in Logistics
Descriptive analytics in logistics focuses on understanding what has already happened. It summarizes historical logistics data into KPIs, dashboards, and reports covering delivery performance, freight costs, inventory levels, and warehouse efficiency, providing foundational operational visibility.
Example
A logistics team reviews last quarter’s on-time delivery rates by carrier to understand performance trends before renegotiating transportation contracts.
Diagnostic Analytics in Logistics
Diagnostic analytics in logistics explains why performance issues occurred. It analyzes variances across routes, carriers, warehouses, and SKUs to uncover root causes of delays, cost overruns, or service failures, enabling faster and more accurate problem resolution.
Example
After repeated shipment delays, analysts trace the issue to a specific lane where carrier handoffs consistently exceed planned transfer times.
Predictive Analytics in Logistics
Predictive analytics in logistics uses historical patterns and machine learning models to forecast future outcomes such as demand spikes, shipment delays, capacity shortages, and service risks. This allows logistics leaders to plan ahead, allocate resources proactively, and reduce operational surprises before they impact customers or costs.
Example:
Based on seasonal trends and weather data, a shipper predicts increased delays next month and pre-allocates additional carriers to maintain service levels.
Prescriptive Analytics in Logistics
Prescriptive analytics in logistics recommends the best actions to take based on predicted scenarios. It evaluates trade-offs between cost, speed, and service to suggest optimal routes, inventory levels, staffing plans, or carrier choices across complex logistics networks.
Example:
When congestion increases, the system recommends rerouting priority shipments while delaying low-urgency orders to control costs and protect delivery commitments.
Core Business Use Cases for Logistics Analytics
Logistics analytics is most valuable when it directly supports business-critical decisions across transportation, operations, and network visibility. These core use cases show how analytics improves cost control, service reliability, and operational efficiency at scale.
Transportation & Freight Optimization
Logistics analytics enables data-driven carrier performance comparison, highlighting differences in cost, reliability, and service levels across lanes. By analyzing route efficiency, fuel usage, and freight cost variance, teams can control transportation spend while maintaining delivery commitments. Analytics also supports service-level management by identifying underperforming carriers early and preventing recurring delays.
Warehousing & Distribution Operations
In warehousing, analytics improves fulfillment speed by optimizing picking paths, slotting strategies, and labor allocation. It tracks inventory movement across locations to reduce congestion and handling time. By detecting operational bottlenecks in real time, teams can resolve delays quickly and keep distribution centers running efficiently.
End-to-End Supply Chain Visibility
Logistics analytics connects data from TMS, WMS, ERP, and partner systems to provide unified visibility across regions and partners. This enables cross-region performance analysis, faster exception handling, and better coordination between suppliers, carriers, and fulfillment teams, critical for managing complex, multi-party supply chains.
Demand Forecasting & Inventory Optimization.
By combining historical shipment data with real-time demand signals, logistics analytics improves demand forecasting and inventory planning. This helps businesses prevent stockouts, reduce excess inventory, and align transportation capacity with expected demand, balancing cost efficiency with service reliability.
Logistics Short Cycle Metrics KPIs
Logistics short cycle metrics KPIs measure day-to-day and week-to-week operational performance across transportation, warehousing, and order fulfillment. Unlike long-term strategic KPIs, short cycle logistics metrics help teams detect issues early, act faster, and continuously optimize execution. These KPIs are critical for improving delivery speed, operational efficiency, and customer satisfaction in modern supply chains.
Short cycle KPIs are especially valuable in high-volume, time-sensitive logistics environments where small delays can quickly scale into major cost or service problems.
Key Logistics Short Cycle Metrics and KPIs
Order Cycle Time
Tracks the time taken from order placement to final delivery. Monitoring this KPI helps logistics teams identify delays across picking, packing, shipping, and last-mile delivery.
On-Time Delivery Rate (OTD)
Measures the percentage of orders delivered within the promised timeframe. It is a core short cycle KPI for evaluating carrier performance and service reliability.
Daily Fulfillment Rate
Shows how many orders are fulfilled within a day compared to total incoming orders. This metric highlights daily throughput and fulfillment bottlenecks.
Pick and Pack Cycle Time
Measures how long warehouse teams take to pick items and prepare them for shipment. Reducing this cycle time directly improves warehouse productivity and dispatch speed.
Truck Turnaround Time
Tracks the time a vehicle spends at a warehouse or distribution center from arrival to departure. Lower turnaround times indicate efficient loading, unloading, and dock operations.
Inventory Accuracy Rate
Evaluates how closely system inventory matches physical stock levels. High accuracy reduces order delays, rework, and fulfillment errors.
Why Short Cycle Metrics Matter in Logistics Analytics
Short cycle logistics KPIs provide real-time operational visibility, allowing teams to react quickly to disruptions, manage daily performance, and prevent small inefficiencies from becoming systemic problems. When combined with logistics analytics platforms, these metrics enable continuous improvement, faster decision-making, and more predictable supply chain performance.
How Supply Chain Analysts Actually Use Analytics Day to Day
Based on how logistics and BI teams describe their day-to-day work across practitioner communities.
“Why does the dashboard say 94% on-time delivery when my phone hasn’t stopped ringing all morning?”
That kind of question comes up repeatedly in supply chain and BI discussions, and it reflects daily reality. Analysts don’t optimize averages; they chase exceptions. Most of their time is spent answering urgent why questions about delays, cost spikes, and service failures.
In practice, analysts pull data from TMS, WMS, ERP systems, and spreadsheets to reconstruct what actually happened. A delayed shipment might require checking carrier performance, warehouse availability, order priority changes, and manual Excel models, often under time pressure from operations teams waiting for answers.
Another common practitioner insight: speed beats perfection. Analysts rely on fast diagnostic analysis to support decisions in the moment, flagging high-risk shipments, prioritizing exceptions, and helping teams choose the least disruptive option when trade-offs are unavoidable. Predictive insights help, but day-to-day value comes from making messy data usable, fast.
DHL Use Case: Data-Driven Control Towers Powered by Logistics Analytics
DHL highlights data-driven control towers as a real-world application of logistics analytics in complex, global supply chains. These control towers centralize real-time and historical logistics data, such as shipment status, weather conditions, and capacity constraints, to provide end-to-end visibility and decision support. By applying advanced logistics analytics and AI, teams can predict disruptions, prioritize exceptions, and take corrective action before delays escalate. This approach shifts logistics analytics from static reporting to real-time, decision-first operations at scale.
Source (Official DHL – Logistics of Things, Data-Driven Control Towers)
Predictive Analytics in Supply Chain
Predictive analytics in supply chain helps businesses use historical and real-time data to forecast future demand, manage inventory, and reduce operational risks. By analyzing patterns in sales, shipping, and supplier performance, companies can predict delays, shortages, and market changes in advance. This allows teams to plan better, optimize routes, and avoid unnecessary costs. Predictive models also improve customer satisfaction by ensuring timely deliveries and accurate order fulfillment. With the support of AI and machine learning, supply chain predictive analytics makes operations more efficient, flexible, and data-driven. As competition grows, businesses that use predictive analytics gain better visibility and stronger control over their entire supply chain.
Why Traditional Analytics Approaches Fall Short
Traditional analytics approaches struggle in modern logistics environments because they are built for historical reporting, not real-time decision-making. As supply chains become more dynamic and data volumes increase, these methods fail to keep pace with rapid operational changes and growing complexity.
Most traditional analytics relies on batch processing and static dashboards, making it difficult to respond to delays, disruptions, or cost spikes as they happen. They also perform poorly with unstructured and semi-structured data, limiting visibility into real-world operational signals that matter most.
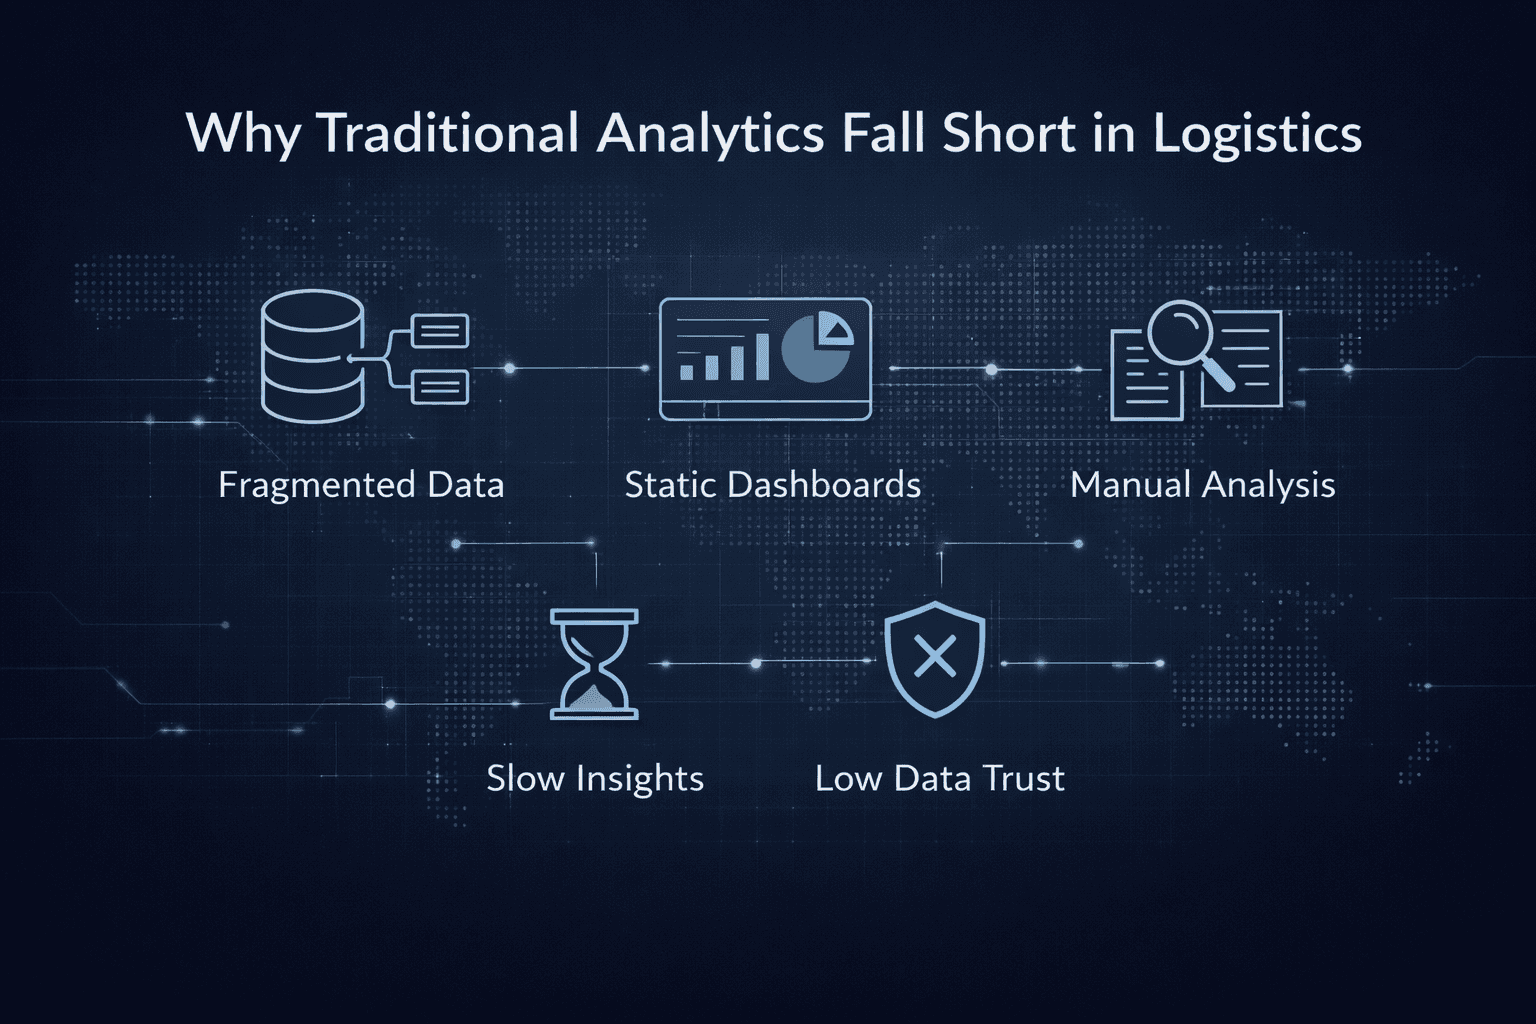
Common limitations include:
Fragmented data sources across TMS, WMS, ERP, and spreadsheets
Static dashboards that explain outcomes after the fact
Manual analysis that slows investigation and response
Slow time to insight when decisions are time-sensitive
Low trust in numbers due to inconsistent data and delayed updates
As a result, teams spend more time reconciling data than acting on it, creating a clear gap between analytics and operational decision-making.
What to Look for in a Logistics Analytics Platform
When evaluating a logistics analytics platform, the focus should be on how well it supports real operational decisions, not just reporting. The right platform connects fragmented data, surfaces actionable insights quickly, and helps teams respond to issues as they happen across the supply chain.
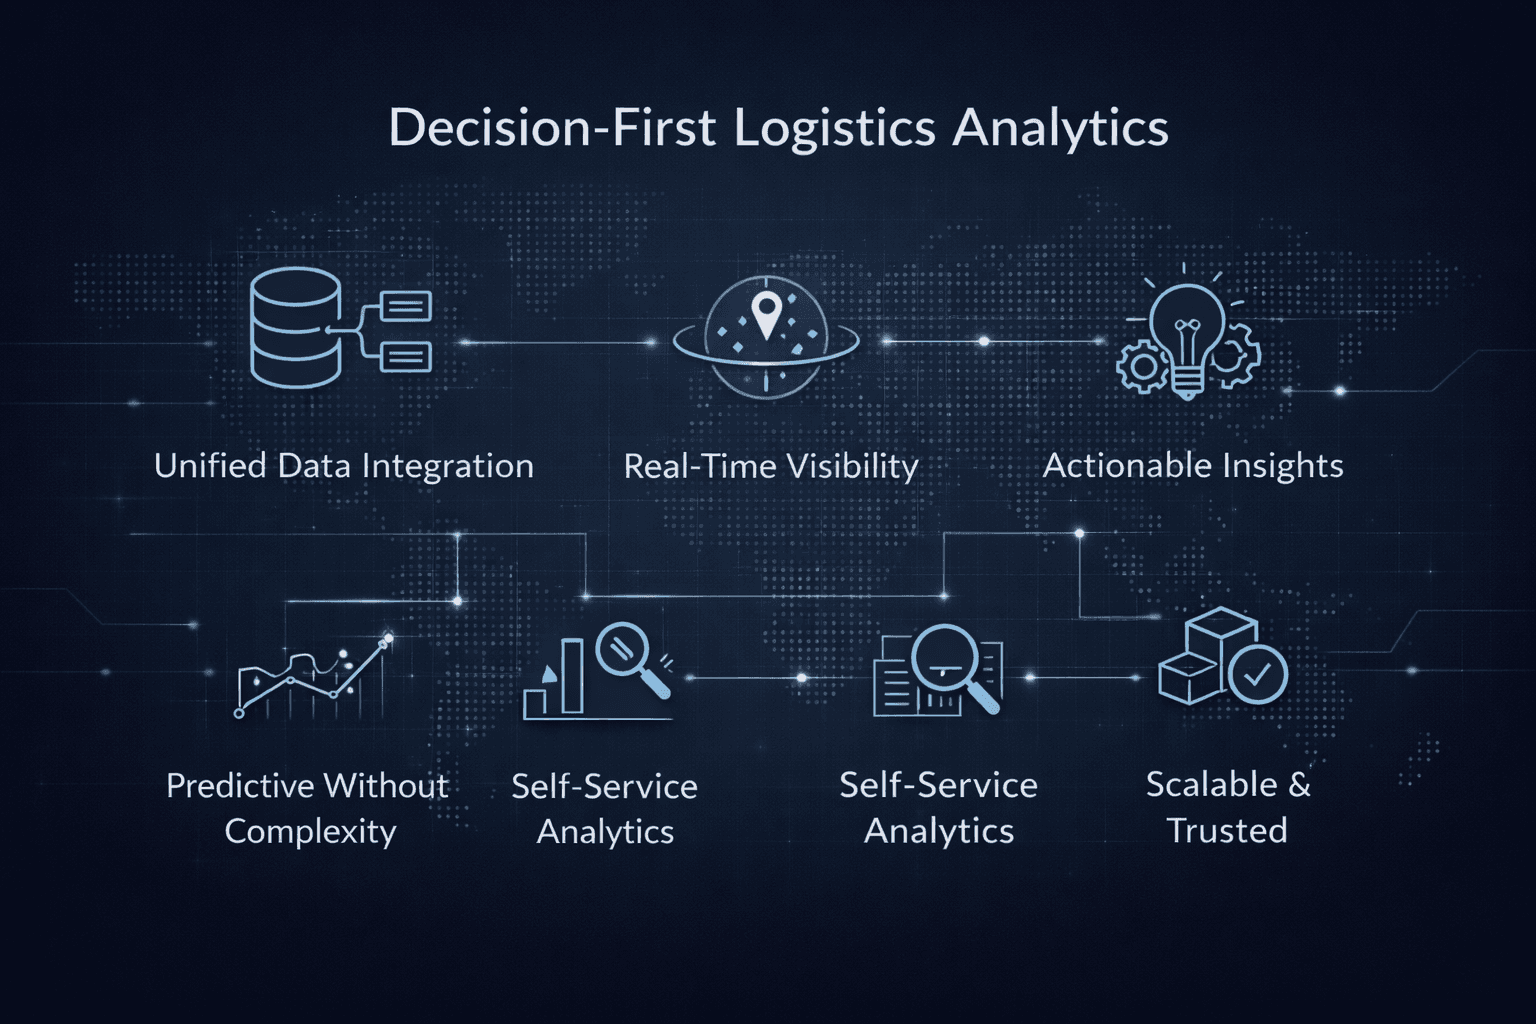
Key capabilities to look for include:
Unified data integration: Seamless connectivity with TMS, WMS, ERP systems, IoT sensors, and partner data through APIs or EDI to create a single, trusted view of logistics operations.
Real-time visibility and tracking: Live monitoring of shipments, vehicles, and inventory across transport modes, enabling faster exception handling and proactive decision-making.
Actionable and prescriptive insights: The platform should go beyond dashboards by recommending what action to take next, such as rerouting shipments or reallocating capacity.
Predictive analytics without heavy setup: Built-in forecasting for demand, delays, and disruptions that logistics teams can use without complex modeling or data science expertise.
Self-service analysis for business users: Intuitive dashboards and flexible exploration tools that allow operations and supply chain teams, not just analysts, to answer urgent questions.
Scalability, automation, and trust: Automated data processing, consistent metrics, and explainable insights that scale with growing data volumes and build confidence in the numbers.
A strong logistics analytics platform acts as a decision-support system, helping teams move faster, reduce risk, and align daily operations with business goals.
From Analytics to Action: Implementing Logistics Analytics in Practice
Effective logistics analytics starts with decisions, not dashboards. The goal is to align insights with real operational workflows so teams can act quickly. By making analytics accessible to non-technical users, organizations move beyond visibility toward prediction and automation, turning analytics into a system that supports faster, better logistics decisions.
The Future of Logistics Analytics
The future of logistics analytics is moving toward AI-driven, decision-first systems that prioritize answers over dashboards, automate responses, and embed intelligence directly into daily logistics workflows.
Predictive and prescriptive analytics will become standard, helping teams anticipate disruptions, optimize routes, and act before delays or cost overruns occur.
AI-assisted decision support will guide planners by evaluating trade-offs across cost, speed, risk, and service in real time, reducing manual analysis.
Conversational analytics will allow business users to ask questions in natural language and receive clear, operationally relevant answers instantly.
Fewer dashboards, more answers will define analytics success, shifting focus from static reporting to actionable guidance tied to execution.
McKinsey-style insight: Organizations that embed advanced analytics into core operations can improve logistics efficiency, reduce disruption impact, and build more resilient, faster-responding supply chains
Frequently Asked Questions(FAQs)
How can data analytics improve supply chain performance?
Data analytics improves supply chain performance by increasing visibility, identifying inefficiencies, predicting disruptions, and enabling faster decision-making. It helps optimize inventory, transportation, and supplier performance while reducing costs and improving service reliability.
How is data analytics used in logistics?
Data analytics is used in logistics to optimize routes, monitor shipments in real time, forecast demand, improve warehouse operations, and evaluate carrier performance. It turns operational data into actionable insights for daily execution.
What are the main benefits of logistics analytics for businesses?
Logistics analytics helps businesses reduce transportation costs, improve delivery reliability, increase operational efficiency, minimize risks, and enhance customer satisfaction by supporting proactive, data-driven logistics decisions.
What is the difference between logistics analytics and supply chain analytics?
Logistics analytics focuses on transportation, warehousing, and delivery execution, while supply chain analytics covers the broader network, including sourcing, production, inventory planning, and end-to-end demand and supply coordination.
Conclusion: Turning Logistics Data Into Better Decisions
Logistics analytics creates value when it supports real decisions, not just reporting. Instead of static dashboards, modern teams need answers that help them act quickly under operational pressure. When logistics analytics is treated as core infrastructure,connecting data, explaining exceptions, and guiding action, it improves efficiency, resilience, and service outcomes. If you’re exploring how to apply logistics analytics in practice.
If you want to see how Supaboard helps logistics teams connect data, investigate exceptions, and turn analytics into real decisions, book a demo with our team.
We’ll walk through how Supaboard works with logistics data and show real workflows for transportation, warehousing, and supply chain analytics.


