
Predictive vs Descriptive Analytics: A Complete Guide
Explore the difference between descriptive and predictive analytics. Learn use cases, tools, and when to use each; with real-world examples.


Introduction
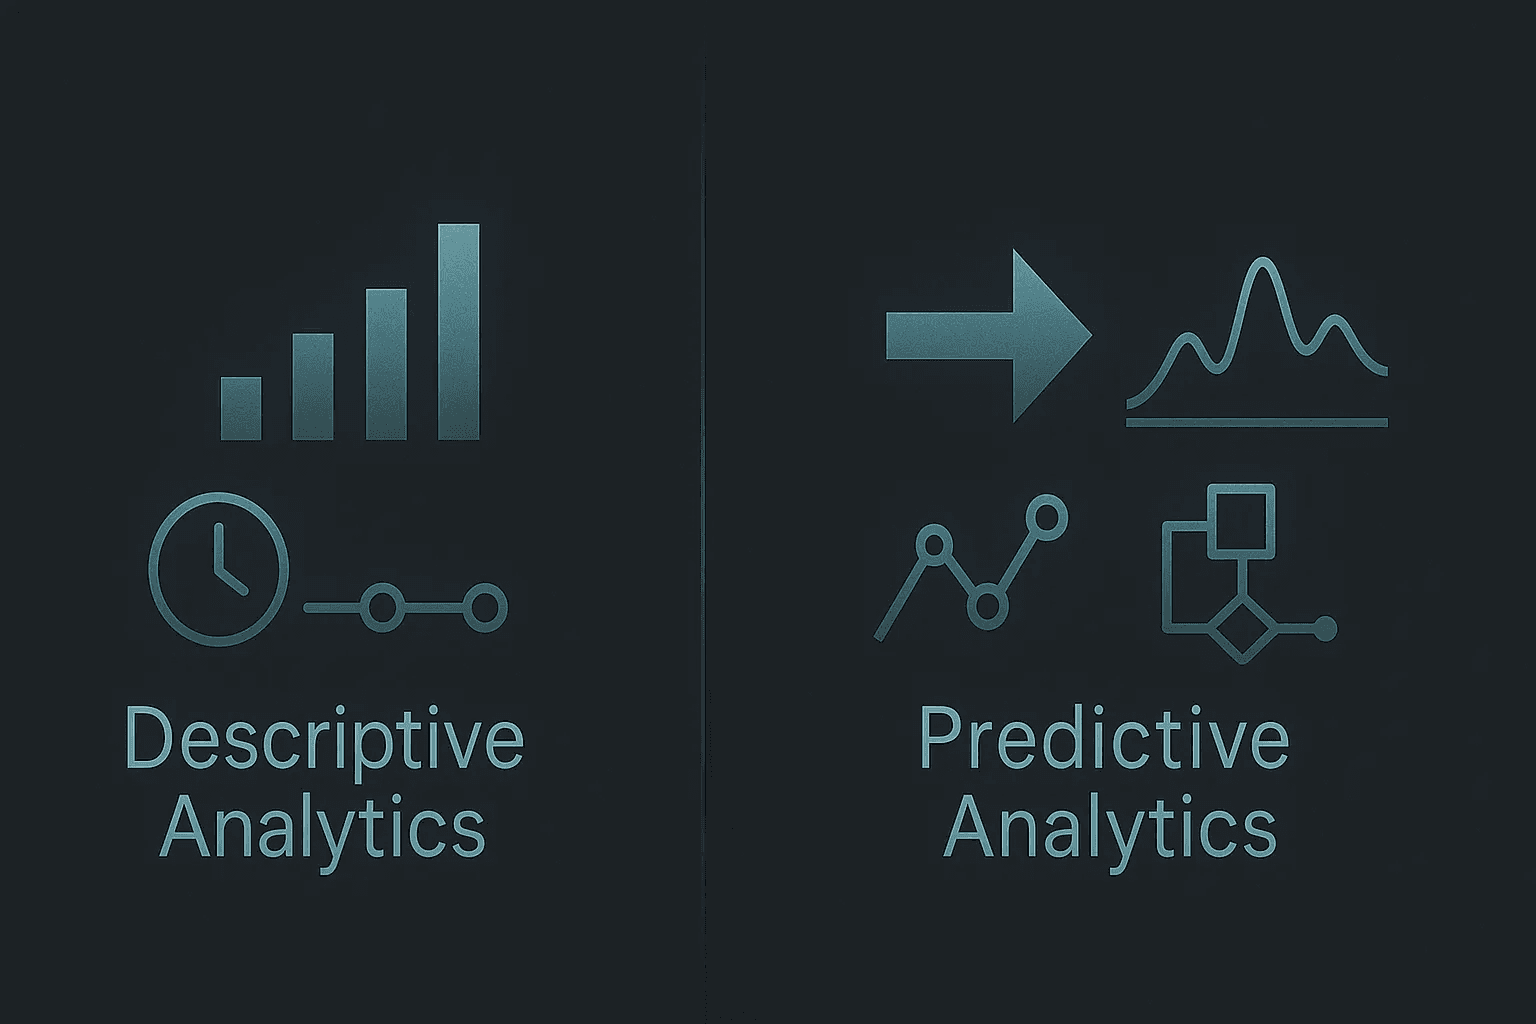
Understanding the difference between descriptive and predictive analytics is essential for businesses looking to turn data into actionable insights. Descriptive analytics focuses on analyzing historical data to explain what has already happened, while predictive analytics uses statistical models and machine learning to forecast future outcomes.
Together, they form the foundation of modern data-driven decision-making. However, many organizations struggle to distinguish between these approaches or understand when to use each effectively. In this guide, we’ll break down how descriptive and predictive analytics work, highlight their key differences, and explore real-world examples. We’ll also briefly touch on prescriptive analytics to give you a complete view of how businesses use data to optimize performance and plan ahead.
What is Descriptive Analytics?
Descriptive analytics focuses on analyzing historical data to understand what has already happened within a business. It converts raw data into meaningful summaries through dashboards, reports, KPIs, and visualizations. Organizations use it to monitor performance, identify trends, detect anomalies, and gain clarity on past outcomes, making it a foundational layer for data-driven decision-making across departments.
Example: A large enterprise uses a centralized BI dashboard to review quarterly revenue, region-wise sales performance, customer retention rates, operational costs, and SLA compliance, enabling executives to evaluate performance, compare departments, and align future strategy based on past results.
Why Descriptive Analytics Is Important?
Descriptive analytics helps businesses turn raw data into useful insights for better decision-making.
It answers questions such as:
How did our sales perform last quarter?
Which products or services are most popular?
What patterns do we notice in customer feedback or support tickets?
By looking at facts instead of assumptions, leaders can identify what’s working well and what needs improvement.
How Descriptive Analytics Works?
The process usually involves three main steps:
Collecting Data – From sources like CRMs, accounting software systems, and customer surveys.
Summarizing Data – Grouping and calculating key performance metrics.
Visualizing Insights – Turning numbers into charts, dashboards, or reports for easy understanding.
Real-Life Example
Starbucks uses descriptive analytics to review customer purchase behavior. For example, their data teams regularly analyze which drinks sell best at certain times of the year. During summer, they often notice a spike in cold brew and Frappuccino sales. This information helps them adjust inventory, marketing, and promotions to match demand all based on real data from past trends.
What is Predictive Analytics?
Predictive analytics focuses on forecasting what is likely to happen next by analyzing historical and current data. It helps organizations anticipate outcomes, understand future behavior, and make proactive decisions instead of reactive ones. By identifying patterns and relationships in past data, teams can plan ahead, reduce uncertainty, and optimize strategies.
Common goals include predicting trends, forecasting demand, identifying risks, and anticipating customer behavior using statistical models and machine learning techniques.
Example: A business predicts customer churn by analyzing past purchase history, product usage, support tickets, and engagement data to proactively retain at-risk customers.
Why Predictive Analytics Is Important
Predictive analytics is important because it helps businesses move from reacting to events to proactively shaping outcomes. Instead of relying only on past data, organizations can use predictive models to anticipate what is likely to happen next and act before problems or opportunities fully emerge.
For example, predictive analytics can help teams:
Identify customers at risk of churning so they can take action to retain them
Forecast product demand to avoid overstocking or stockouts
Detect fraud or operational risks early, before they lead to significant losses
This forward-looking approach improves decision-making across departments, from marketing and sales to finance and operations. By reducing uncertainty and enabling faster, data-driven actions, predictive analytics helps organizations save costs, increase efficiency, and stay competitive in dynamic markets.
How Predictive Analytics Works
The process usually involves:
Data Collection: Gathering historical and live data.
Pattern Recognition: Using algorithms to find relationships between variables.
Model Training: Creating statistical or machine learning models based on past trends.
Prediction and Action: Applying these models to forecast outcomes and take proactive measures.
Example:
UPS, one of the world’s largest logistics companies, uses predictive analytics to optimize delivery routes and anticipate delays. By analyzing weather patterns, traffic data, and past delivery times, UPS can predict potential disruptions and reroute trucks before problems occur. This has saved the company millions of dollars in fuel and significantly improved delivery times.
In simple terms, predictive analytics helps you prepare for the future by learning from the past.
Descriptive vs Predictive Analytics at a Glance
Feature | Descriptive Analytics | Predictive Analytics |
|---|---|---|
Goal | Understand what has happened | Anticipate what is likely to happen |
Focus | Past data and historical trends | Future outcomes and potential trends |
Key Questions | What happened? Why did it happen? | What will happen? What could happen if X changes? |
Data Dependency | Relies on historical data | Uses historical data combined with statistical models and machine learning |
Techniques Used | Data aggregation, reporting, dashboards, data visualization | Regression analysis, classification, forecasting, machine learning |
Tools & Technologies | Supaboard, Tableau, Power BI | Scikit-learn, TensorFlow, forecasting tools and APIs |
Example Use Case | Monthly sales report highlighting top-performing products | Forecasting next quarter’s sales based on historical trends |
Primary Users | Business analysts, operations teams | Data scientists, analytics teams, strategy leaders |
If you're just getting started with analytics, it helps to understand the broader landscape first.
Check out our guide to descriptive analytics to see how it works in real-world scenarios, or explore the four main types of analytics to see where descriptive and predictive fit in.
Descriptive and Predictive Analytics: How Businesses Use Each Type
Descriptive Analytics in Action
Descriptive analytics is ideal when you want to evaluate performance or spot patterns.
Example – Retail:
Walmart uses descriptive analytics to track daily transactions and identify buying patterns. For instance, they noticed that customers often buy Pop-Tarts before hurricanes, an insight that helps them stock up on the right products before storms.
Example – Education:
Universities use descriptive analytics to analyze student attendance, grades, and engagement trends to understand which programs perform best and where students struggle most.
Predictive Analytics in Action
Predictive analytics is useful when you want to forecast and prepare for future events.
Example – Healthcare:
Mount Sinai Hospital in New York uses predictive analytics to identify patients at high risk of readmission. By analyzing patient history, lab results, and treatment data, doctors can provide early interventions and reduce hospital readmissions.
Example – Retail:
Amazon uses predictive analytics to anticipate what products customers are likely to buy next. This enables faster delivery and more relevant product recommendations a core reason behind its success.
Limitations of Descriptive Analytics
Descriptive analytics is limited because it only explains past events and does not provide insights into why they happened or what will happen next.
Key Limitations
Only analyzes historical data
Does not predict future outcomes
Heavily dependent on data accuracy
Encourages reactive decision-making
Explanation
Descriptive analytics focuses on summarizing past data, which makes it useful for reporting but limited for decision-making. It cannot forecast future trends or provide actionable recommendations, which restricts its value in fast-changing environments.
Its effectiveness also depends entirely on data quality. If the data is incomplete, outdated, or inconsistent, the insights generated can be misleading. This can result in poor business decisions based on inaccurate information.
Because it looks only at past performance, descriptive analytics often leads organizations to react to events after they happen rather than proactively planning for future opportunities or risks.
Best Used When
You need to track performance (e.g., dashboards, KPIs)
You want a clear summary of past results
You are building a baseline before advanced analytics
Limitations of Predictive Analytics
Quick Answer
Predictive analytics is limited because it relies on data quality and statistical probabilities, meaning predictions are not always accurate and require continuous model updates.
Key Limitations
Requires large volumes of high-quality data
Predictions are probabilistic, not exact
Models degrade over time (model drift)
Requires technical expertise to maintain
Explanation
Predictive analytics uses historical data and machine learning models to forecast future outcomes. However, its accuracy depends heavily on the quality and volume of data available. Poor or limited data can lead to unreliable predictions.
Even with strong data, predictive models do not provide guaranteed outcomes—they estimate probabilities. This means results must be interpreted carefully and combined with business context.
Over time, changes in user behavior, market trends, or external factors can reduce model accuracy. This is known as model drift. To remain effective, predictive models must be continuously monitored, updated, and retrained.
Best Used When
You need to forecast demand, churn, or risk
You have access to clean, large datasets
You can support ongoing model maintenance
Turn Descriptive and Predictive Analytics into Actionable Growth with Supaboard
Supaboard helps you unify historical insights and future forecasting in one powerful, easy-to-use analytics platform. From real-time dashboards and KPI tracking to AI-driven predictions and embedded reports, Supaboard enables teams to move faster, make smarter decisions, and stay ahead of change. Stop reacting to data. Start leading with it. Build clarity, confidence, and scalable growth with Supaboard.
Frequently Asked Questions: FAQs
1. What is the relationship between descriptive and predictive analytics?
Descriptive and predictive analytics are closely related. Descriptive analytics looks at past data to understand what happened, while predictive analytics uses that data to forecast what is likely to happen in the future. In practice, descriptive analytics provides the foundation for predictive models.
2. Is forecasting sales descriptive or predictive?
Forecasting sales is an example of predictive analytics. It involves using historical sales data along with external variables to predict future performance.
3. Is a reactive approach descriptive or predictive?
A reactive approach is associated with descriptive analytics, as it focuses on analyzing past performance or events after they have occurred.
4. What is the difference between descriptive and predictive analytics?
Descriptive analytics summarizes past data to understand trends and outcomes, while predictive analytics uses data, algorithms, and machine learning to forecast future results. Descriptive tells you what happened; predictive tells you what could happen.
5. Is predictive analytics better than descriptive analytics?
Not necessarily, they serve different purposes. Descriptive analytics is essential for understanding current and past trends, while predictive analytics helps organizations plan for the future. The best analytics strategies often use both together.
6. What are some tools used in descriptive and predictive analytics?
Descriptive analytics tools: Excel, Google Data Studio, Power BI, Tableau
Predictive analytics tools: Python, R, IBM SPSS, RapidMiner, SAS, TensorFlow
7. Is descriptive analytics also known as reporting analytics?
Yes. Descriptive analytics is often referred to as reporting analytics, especially in business intelligence contexts. It focuses on creating dashboards and reports based on historical data.
8. Is predictive analytics a proactive approach?
Yes. Predictive analytics is considered proactive because it helps organizations anticipate future events and take action in advance.
9. Can a single system use both descriptive and predictive analytics?
Absolutely. Many modern analytics platforms integrate both types. For example, a BI tool might provide real-time dashboards (descriptive) and also run predictive models in the background.
10. How does prescriptive analytics fit into this?
Prescriptive analytics goes one step beyond predictive analytics. It not only forecasts what might happen but also recommends specific actions to take. It’s the most advanced analytics type in the data analytics spectrum.
conclusion
In conclusion, understanding the difference between descriptive and predictive analytics is essential for building a strong data strategy. Descriptive analytics helps you understand what has already happened, while predictive analytics helps you anticipate what might happen next.
On their own, each has limitations. But when combined, they give you a clearer and more complete view of your data. This allows businesses to move beyond reacting to past events and start planning ahead with confidence.
By using both approaches together, organizations can reduce risks, spot opportunities earlier, and make better decisions. In today’s fast-moving, data-driven world, this combination is key to staying competitive and achieving long-term growth.


