
Financial Dashboard Examples You Should Use in 2026 (With KPIs)
Exploreadding financial dashboard examples with key KPIs, real use cases, and layouts businesses use to track revenue, cash flow, and performance in real time.


Introduction
Modern finance teams manage massive volumes of data across ERP systems, accounting software, billing platforms, CRM tools, and operational databases. While this data holds valuable insights, turning it into clear and timely decisions remains a major challenge for many organizations.
Deloitte’s Finance Trends research shows that finance leaders are increasingly expected to move beyond traditional reporting and play a strategic role in business growth. At the same time, McKinsey highlights that companies using advanced analytics make significantly better financial decisions and outperform their competitors.
As a result, financial dashboard examples, often referred to as fin dash systems, have become essential for high-performing organizations. A well-designed financial dashboard does more than display numbers. It creates a shared financial understanding across leadership, operations, and strategy.
This guide explains how financial dashboards work in practice, how different teams use them, and what makes them effective for long-term business performance.
What Is a Financial Dashboard?
A financial dashboard is a real-time analytics tool that consolidates key financial data, such as revenue, expenses, cash flow, and profitability, into a single, visual interface. It helps finance teams and business leaders monitor performance, track KPIs, and make faster, data-driven decisions without relying on static reports.
Unlike traditional financial reports that only reflect past performance, modern financial dashboards connect directly to systems like accounting software, ERP platforms, and billing tools. This allows organizations to analyze trends, detect risks early, and continuously optimize financial outcomes using live, centralized data.
The Real Reason Financial Dashboards Don’t Work
Most financial dashboards don’t fail because of poor tools, they fail because they’re not built for decisions.
In many cases, dashboards are designed around available data instead of the questions businesses actually need answered. Over time, teams keep adding new KPIs without removing outdated ones, turning the dashboard into a cluttered view that’s hard to interpret. Reports are reviewed regularly, but without clear ownership or action tied to them, insights rarely translate into decisions. When data quality is inconsistent, trust drops, and the dashboard becomes something teams check, but don’t rely on.
The result is a dashboard that looks complete but delivers very little real value.
High-performing finance teams approach this differently. They build dashboards around specific decisions, limit metrics to what truly matters, and ensure every insight connects to action. Instead of just reporting performance, their dashboards actively guide it.
Core Features of a Financial Dashboards
A strong financial dashboard helps businesses clearly track and understand their financial performance. It brings important financial data into one place, making monitoring, analysis, and decision-making faster and easier for teams and leaders.
Real-Time Data Integration: A financial dashboard should connect directly with systems like ERP, accounting, payroll, and CRM platforms to keep data accurate and up to date.
Live Financial Monitoring: Teams should be able to track revenue, expenses, cash flow, and liquidity in real time without waiting for manual reports.
Interactive Visual Design: Well-designed dashboard templates use clean layouts, simple charts, and consistent formatting so users can quickly understand financial information.
Drill-Down Analysis: Users should be able to move from summary numbers to detailed transaction data to identify the exact source of changes or issues.
Flexible Filtering: Filtering options such as region, department, or product category help users analyze financial performance from different perspectives.
Forecasting and Scenario Planning: Advanced dashboards allow businesses to run budget simulations and financial forecasts to plan future strategies more effectively.
These features ensure that dashboards support real business decisions.
According to McKinsey, companies that actively use data and analytics in decision-making are far more likely to outperform competitors, with advanced analytics improving financial decisions by up to 20–30 percent. This highlights why modern finance teams need real-time dashboards.
Looking for real-world use cases? Explore these financial dashboard examples to see how businesses track performance.
Financial Dashboard Examples
1. CFO Dashboard
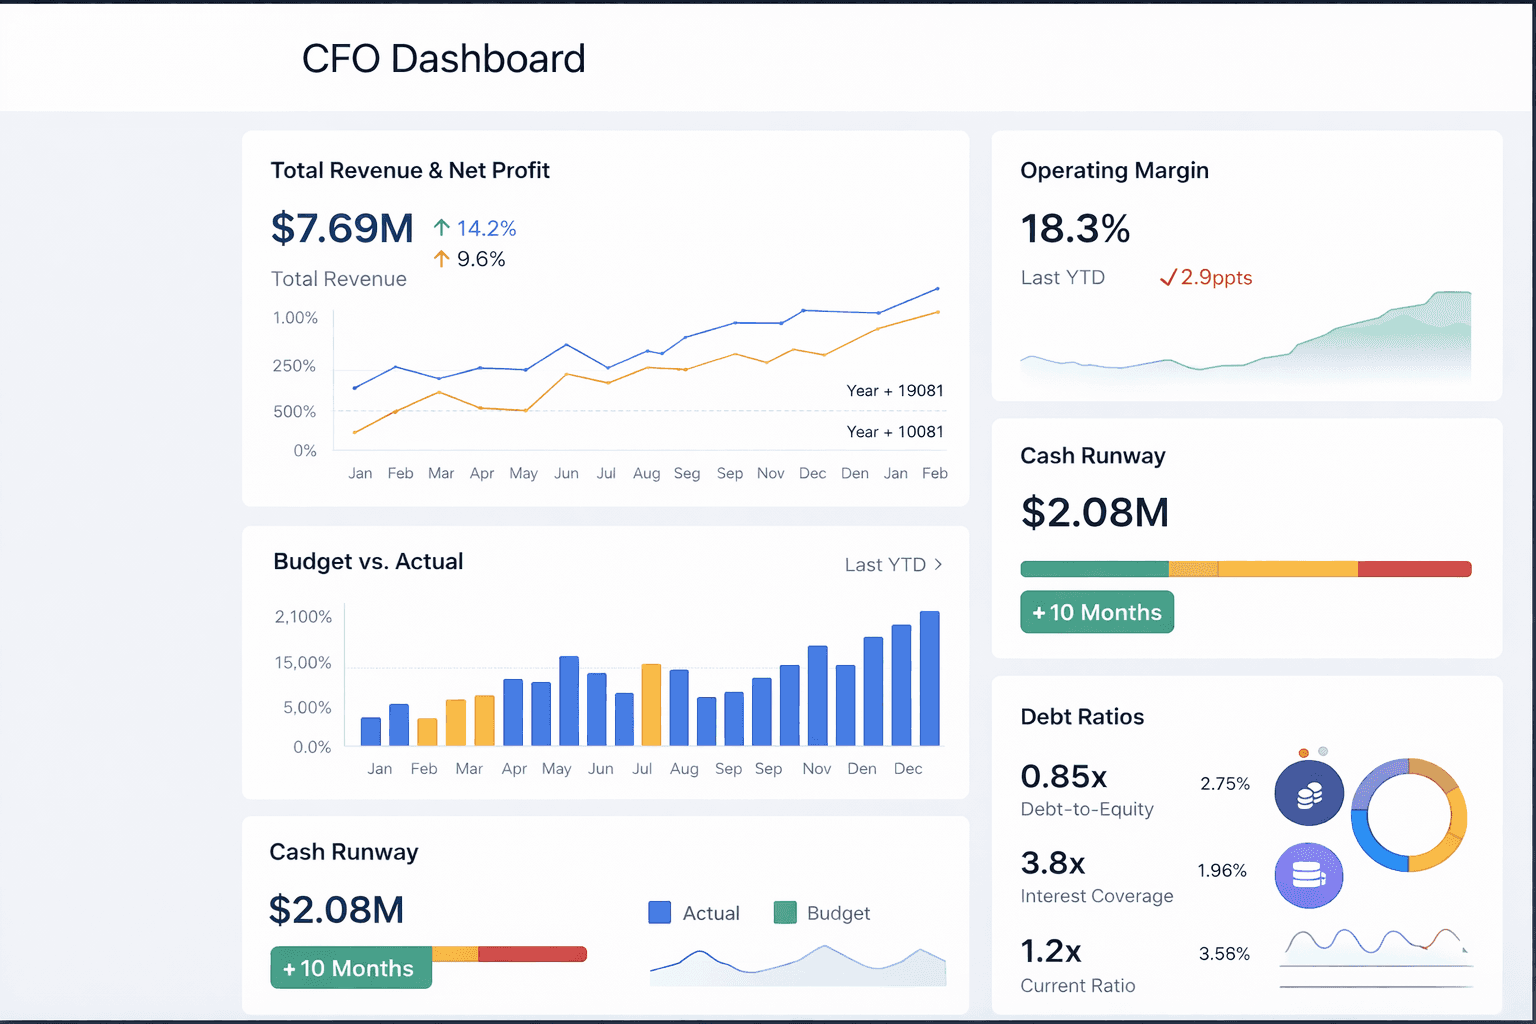
CFO (Chief Financial Officer) brings together essential financial information from across the organization into a single, easy-to-understand view. A CFO dashboard presents real-time data on revenue, expenses, cash flow, profitability, and budget performance, helping leaders clearly understand the company’s financial position. By highlighting trends, risks, and opportunities, it supports strategic planning, improves financial control, and enables executives to take timely actions that strengthen long-term stability and business growth.
Key Financial Metrics for CFO Decision-Making
Total revenue and net profit: Measures overall business growth, profitability trends, and long-term financial sustainability across departments and markets.
Operating margin: Evaluates how efficiently core business operations generate profits after accounting for operational and administrative expenses.
Cash runway: Estimates how long current cash reserves can sustain operations under existing spending and revenue conditions.
Budget vs. actual: Identifies spending deviations by comparing planned budgets with real expenses across business units and projects.
Debt ratios: Assesses long-term financial risk by evaluating leverage, repayment capacity, and balance sheet stability.
Real Use Case
A multinational services firm implemented a CFO across 14 subsidiaries. Early detection of liquidity pressure reduced short-term borrowing costs by 18% in one year.
This dashboard supports board reporting and capital planning.
2. Financial Performance Dashboard
Financial performance dashboard provides a clear view of how efficiently the business is using its resources to generate revenue and profits. A financial performance dashboard tracks key indicators such as revenue growth, profit margins, operating income, and return on investment. By analyzing trends and comparing results over time, it helps finance teams identify operational gaps, improve cost management, strengthen profitability, and support long-term financial sustainability and business performance.
Key Financial Metrics for Performance Analysis
Revenue growth rate
Tracks how consistently the business expands across reporting periods, markets, and customer segments.
Gross margin
Measures profitability after deducting direct production and service delivery costs.
Operating income
Shows earnings generated from core business activities before taxes and financing costs.
Return on investment (ROI)
Evaluates how effectively capital investments generate financial returns over time.
Debt-to-equity ratio
Assesses balance sheet stability and long-term financial leverage.
Real Use Case
A retail enterprise improved profit margins by 12% within two quarters after identifying inefficiencies using performance dashboards.
3. Executive Dashboard
An executive dashboard allows senior leaders to view key financial and operational data in one centralized place. It presents complex information in a simplified and visual format, highlighting important metrics such as revenue, profitability, growth trends, and performance indicators. By providing clear and timely insights, it supports strategic planning, improves organizational alignment, and enables faster, more confident executive decision-making.
Key Financial Metrics for Executive Visibility
Total revenue
Summarizes company-wide income performance and growth momentum.
Net profit margin
Shows overall profitability and financial health indicators.
Cash position overview
Displays current liquidity and financial flexibility.
Strategic KPIs
Aligns financial performance with long-term business objectives.
Risk indicators
Highlights potential financial and operational threats.
Real Use Case
A SaaS company reduced executive reporting preparation time by 30% after centralizing leadership dashboards.
4. Cash Flow Dashboard
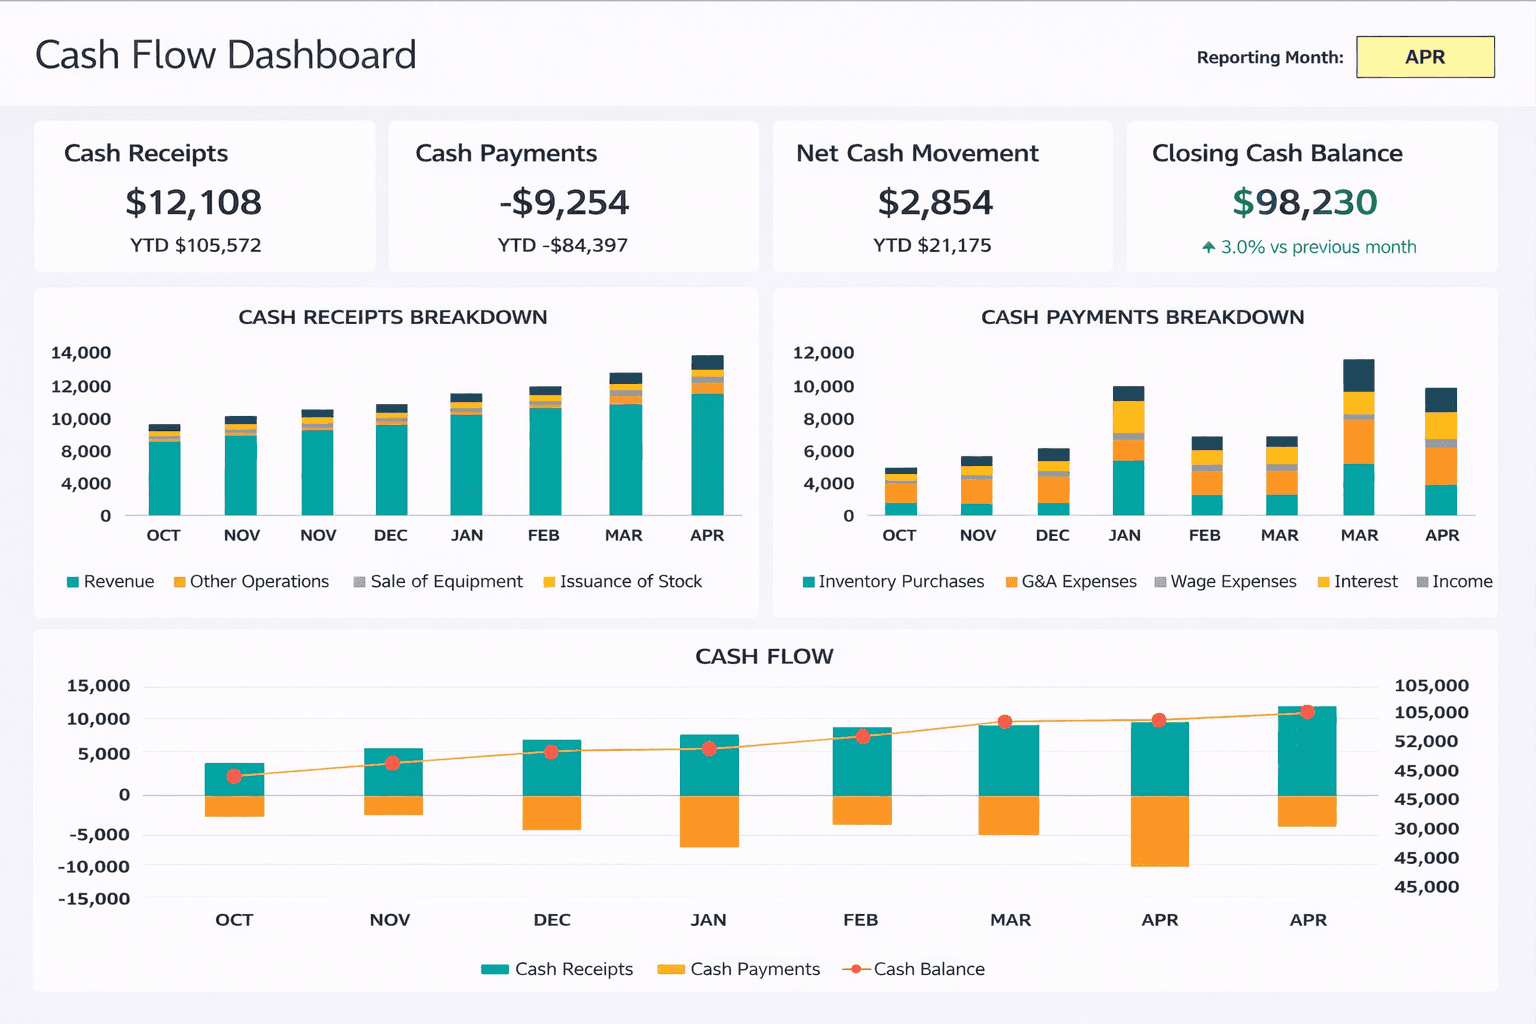
The cash flow dashboard focuses on monitoring how money moves in and out of the business. It helps finance teams maintain liquidity, prevent short-term financial stress, and ensure the company can meet its operational obligations.
This dashboard is especially important for fast-growing companies, seasonal businesses, and capital-intensive industries where delayed payments or unexpected expenses can quickly create financial pressure.
By providing real-time visibility into cash inflows, outflows, and forecasts, the cash flow dashboard enables proactive financial planning and reduces dependency on emergency financing.
Key Financial Metrics for Cash Flow Management
Net cash flow
Tracks the overall increase or decrease in cash position across reporting periods and business cycles.
Operating cash flow
Measures cash generated from core operations, indicating whether daily activities are financially sustainable.
Free cash flow
Shows remaining cash after capital expenditures, supporting expansion and long-term investment planning.
Cash reserves
Displays available liquidity buffer for managing unexpected costs and economic uncertainty.
Cash flow forecast
Projects future liquidity based on revenue patterns, payment cycles, and expense trends.
Real Use Case
A manufacturing company used a cash flow dashboard to monitor delayed customer payments and supplier obligations. By improving collection processes, the firm increased available liquidity by 15% within six months and reduced dependence on short-term credit.
5. Sales and Marketing Financial Dashboard
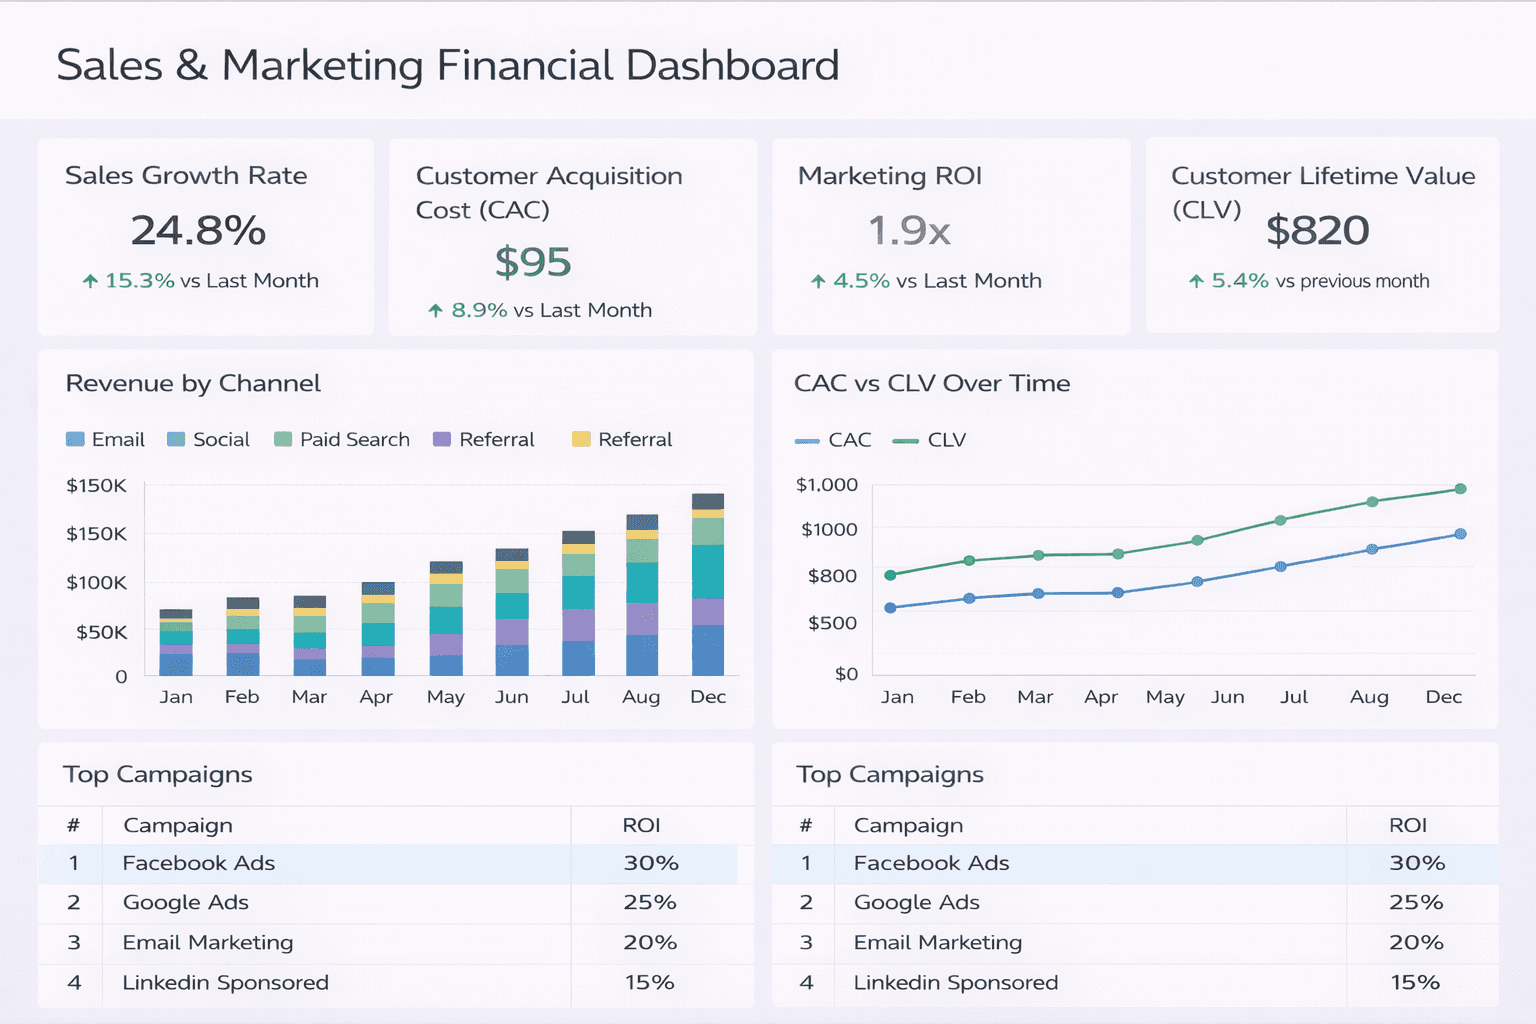
The sales and marketing financial dashboard connects revenue-generating activities with financial performance. It helps organizations understand whether growth initiatives are profitable and sustainable.
Many companies struggle because sales and marketing teams focus on volume, while finance teams focus on margins. This dashboard bridges that gap by combining customer, campaign, and financial data in one view.
It enables leaders to evaluate which channels, products, and campaigns generate the highest return and which drain resources without delivering long-term value.
Key Financial Metrics for Revenue Optimization
Sales growth rate
Measures revenue expansion across regions, products, and customer segments over time.
Customer acquisition cost (CAC)
Tracks the total cost required to acquire new customers through marketing and sales efforts.
Marketing ROI
Evaluates profitability of campaigns by comparing revenue generated against marketing spend.
Conversion rate
Shows how effectively leads move through the sales funnel to become paying customers.
Customer lifetime value (CLV)
Estimates total revenue generated from a customer during the entire relationship.
Real Use Case
A B2B technology company discovered that certain digital campaigns had high traffic but low revenue impact. After reallocating budgets, the firm reduced CAC by 22% and improved marketing ROI within two quarters.
6. Financial Reporting Dashboard
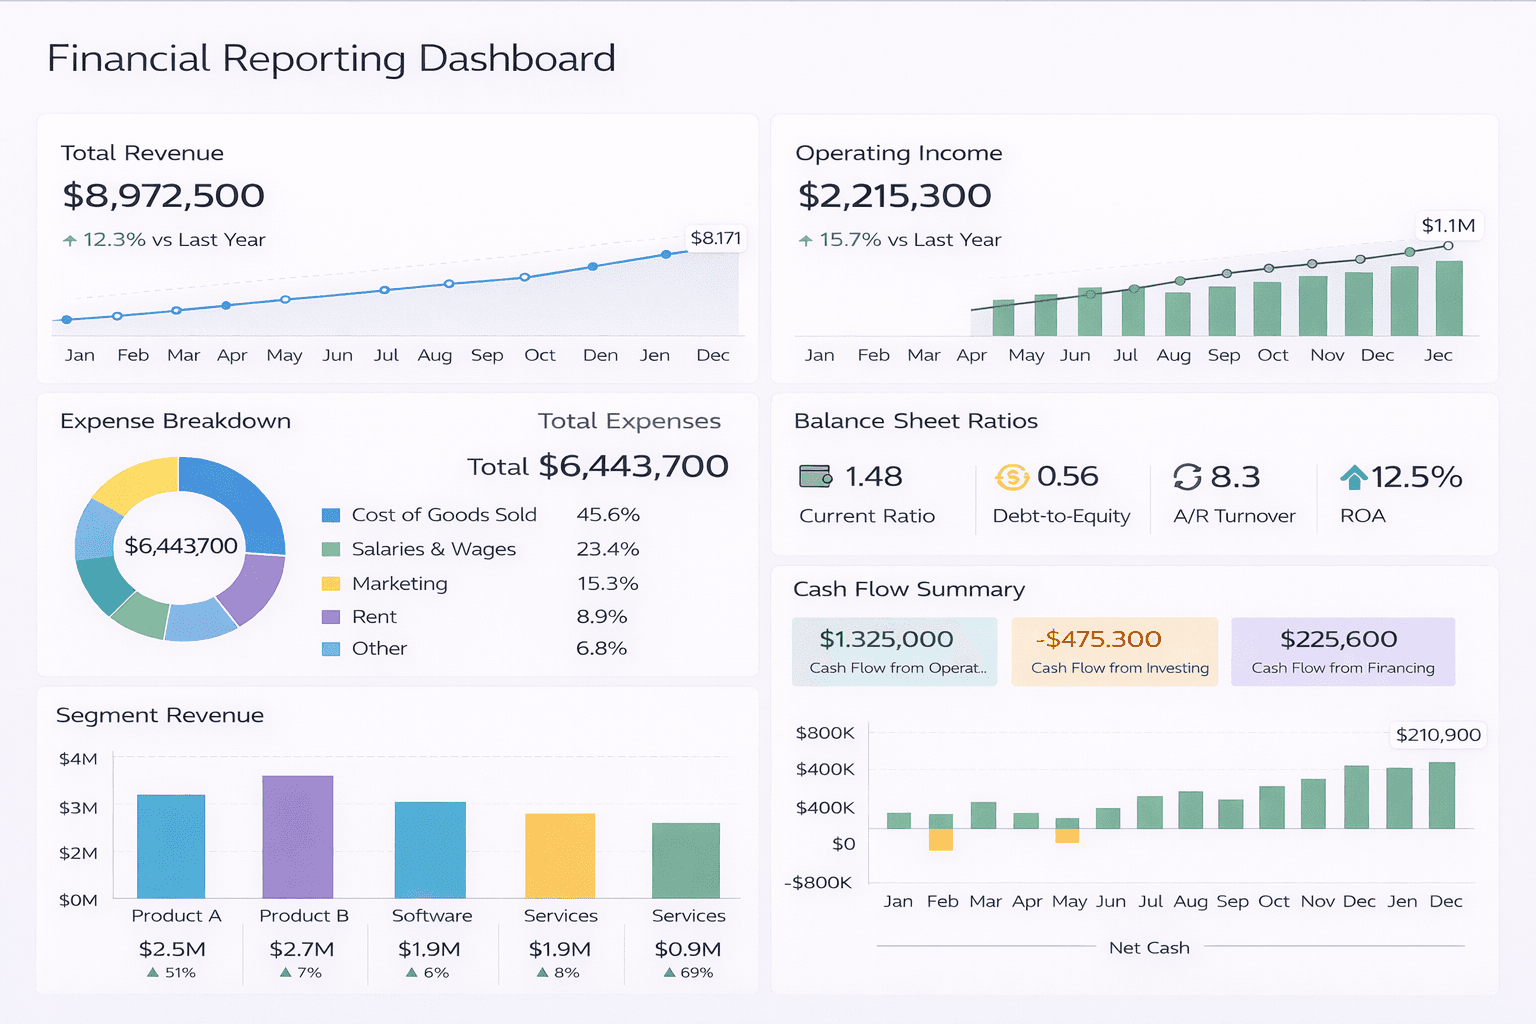
The financial reporting dashboard streamlines statutory, regulatory, and internal reporting processes. It centralizes financial statements, management reports, and compliance documentation in a structured format.
Traditional reporting often requires extensive manual consolidation, increasing the risk of errors and delays. This dashboard automates reporting workflows and ensures consistency across departments and subsidiaries.
It plays a critical role during audits, board reviews, and regulatory filings by providing reliable and standardized financial information.
Key Financial Metrics for Reporting Compliance
Revenue by division
Breaks down income sources across business units and geographic regions.
Expense breakdown
Categorizes operational, administrative, and capital costs for transparency.
Operating margin trends
Tracks long-term profitability and business sustainability.
Balance sheet summary
Shows assets, liabilities, and shareholder equity positions.
Cash flow statements
Summarizes operating, investing, and financing cash movements.
Real Use Case
A multinational enterprise reduced its monthly close cycle from 10 days to 6 days after implementing automated reporting dashboards, improving audit readiness and management reporting accuracy.
7. Actual vs. Forecast Expense Dashboard
The actual vs. forecast expense dashboard compares planned budgets with real spending in real time. It helps finance teams enforce cost discipline and improve financial planning accuracy.
In many organizations, overspending is detected only after reporting cycles close. This dashboard prevents that by highlighting deviations as they occur, allowing managers to take corrective action immediately.
It also improves accountability by making department-level spending visible and measurable.
Key Financial Metrics for Budget Control
Actual vs. forecast comparison
Measures how closely real spending aligns with approved budgets.
Expense variance
Identifies cost overruns across departments and projects.
Trend analysis
Tracks long-term spending behavior and recurring inefficiencies.
Deviation percentage
Quantifies differences between planned and actual expenses.
Forecast updates
Adjusts future projections based on real performance.
Real Use Case
A logistics company used this dashboard to monitor fuel, maintenance, and labor costs. Early variance detection helped reduce operational overspending by 14% within one year.
8. Risk-Adjusted Performance Dashboard
The risk-adjusted performance dashboard evaluates financial returns in relation to associated risks. It is widely used in financial services, manufacturing, infrastructure, and capital-intensive industries.
High returns are meaningless if they expose the company to excessive risk. This dashboard helps organizations balance growth, stability, and regulatory compliance.
It enables leadership to make informed decisions about investments, lending, expansion, and resource allocation while maintaining risk limits.
Key Financial Metrics for Risk Management
Return on equity (ROE)
Measures profitability generated from shareholder investments.
Risk-adjusted return on capital (RAROC)
Evaluates returns relative to risk exposure.
Value at Risk (VaR)
Estimates potential losses under unfavorable market conditions.
Exposure levels
Tracks financial commitments and credit risk.
Risk tolerance indicators
Monitors compliance with approved risk limits.
Real Use Case
A financial institution used risk-adjusted dashboards to monitor credit and market exposure. Improved visibility reduced portfolio volatility by 10% while maintaining stable returns.
A Crisis Example
A retail enterprise faced severe cash shortages after delayed customer payments went unnoticed for months. Without real-time financial dashboards, leadership reacted late. Emergency loans increased interest costs by 25 percent and disrupted long-term investment and expansion plans.
Not sure which chart fits your data? This bar graph vs histogram guide explains it clearly.
Before vs After: Financial Dashboard Transformation
Before:
Finance teams relied on spreadsheets updated monthly. Cash flow issues, budget overruns, and revenue declines were discovered too late, leading to poor forecasting and reactive decision-making.
After:
With a real-time fin dash system, leaders monitored liquidity, expenses, and forecasts daily. Early alerts improved planning accuracy, reduced operational risks, and increased financial stability.
If you’re comparing platforms, this breakdown of business intelligence tools can help you choose the right fit.
Build Your Financial Dashboard in Minutes with Supaboard
Creating and maintaining financial dashboards does not have to be complex or time-consuming. With Supaboard, finance teams can connect their data sources, ask questions in natural language, and instantly generate real-time dashboards for revenue, cash flow, expenses, and forecasts.
Instead of spending hours on spreadsheets and manual reporting, teams can focus on analysis, planning, and strategic decision-making. Start building your financial dashboards faster and smarter with Supaboard.
Frequently Asked Questions (FAQs)
1. What are financial dashboard examples?
Financial dashboard examples are real-world templates or layouts that show how companies track revenue, expenses, cash flow, and profitability. These examples help finance teams understand how to structure dashboards for reporting, forecasting, and performance monitoring across different business functions.
2. What is the difference between a financial dashboard and financial reports?
A financial dashboard provides real-time or regularly updated insights using visual charts and KPIs. Financial reports are static documents created periodically, such as monthly or quarterly statements. Dashboards support ongoing monitoring, while reports focus on historical analysis and compliance.
3. Which KPIs should be included in a CFO dashboard?
A CFO dashboard should include total revenue, net profit, operating margin, cash runway, and budget vs. actual spending. These KPIs provide a balanced view of profitability, liquidity, and financial discipline, helping leaders make informed strategic decisions.
4. How often should financial dashboards be updated?
Most financial dashboards should update daily or in real time, depending on data availability. Cash flow and revenue dashboards often require frequent updates, while reporting dashboards may refresh weekly or monthly to ensure accuracy and consistency.
5. What is the best financial dashboard software for enterprises?
The best financial dashboard software depends on data complexity, security requirements, and integration needs. Enterprises should look for platforms that support ERP integration, automation, customization, and strong governance. Tools like Supaboard and similar platforms focus on simplifying dashboard creation while maintaining analytical depth.
What is a financial dashboard?
A financial dashboard is a centralized analytics tool that consolidates financial data from multiple sources and presents it through charts, tables, and KPIs. It enables finance teams to monitor business performance, compare actuals vs forecasts, and make informed decisions based on real-time insights rather than fragmented reports.
Still relying on manual reports?
Try Supaboard and get real-time financial dashboards with instant insights. Connect your data and see what actually drives your numbers. Start your free 14-day trial.
Conclusion
Modern finance leaders no longer rely on static reports. They rely on financial dashboards and fin dash systems that provide real-time visibility, accountability, and strategic insight. A well-designed financial dashboard is not just a reporting tool. It is a management system that supports forecasting, risk management, and capital planning.
Organizations that invest in accurate data, thoughtful design, and disciplined governance turn financial dashboards into long-term competitive advantages and strengthen their financial decision-making capabilities.


