
Bar Graph vs Histogram: Key Differences, Examples & When to Use Each
Confused between bar graphs and histograms? Learn the main differences (categorical vs continuous data, gaps vs touching bars), real examples, and when to use each for better data visualizations.


Choosing between a bar graph and a histogram confuses many students, analysts, and business professionals. While both charts use bars, they serve completely different purposes and work with different types of data.
A bar graph (also called bar chart) is used to compare distinct categories, such as sales by product, revenue by region, or team performance.
A histogram is designed to show the distribution of continuous numerical data, for example, how customer ages, order values, response times, or test scores are spread across ranges.
The biggest difference lies in data type and bar spacing: bar graphs use gaps to separate categories, while histogram bars touch each other to represent continuous data. Using the wrong chart can hide important patterns like skewness and outliers or make comparisons confusing.
In this guide, you’ll learn:
The clear differences between bar graph and histogram
Practical examples and when to use each
Common mistakes to avoid
How to choose the right chart every time
Mastering this distinction will help you create clearer visualizations, communicate insights better, and make smarter data-driven decisions.
What Is a Bar Graph?
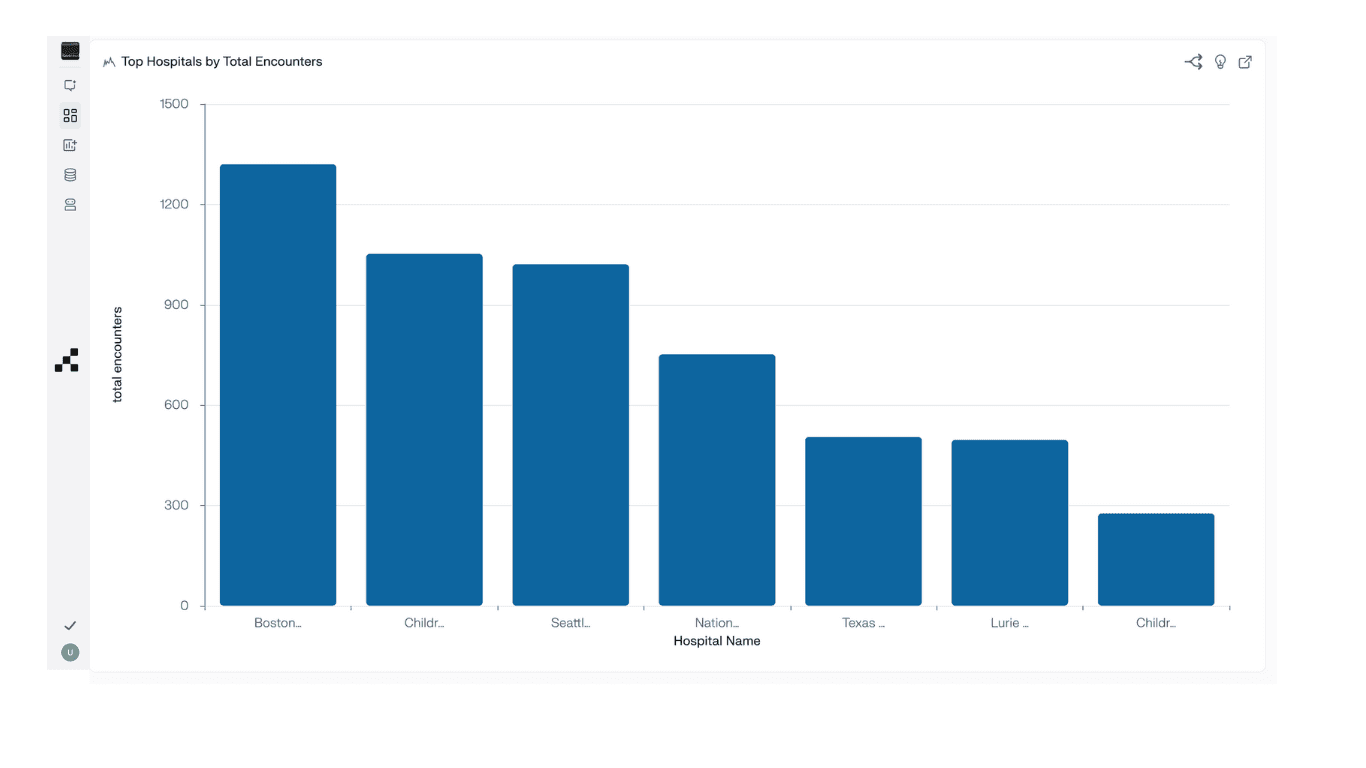
A bar graph, also known as a bar chart, is a data visualization tool used to compare values across distinct categories. Each bar represents a separate category, and the height (or length) of the bar corresponds to its value.
The most important characteristic of a bar graph is that the bars are separated by gaps. These gaps clearly indicate that the categories are independent and not related on a continuous scale.
In simple terms, bar graphs make it easy to compare different groups at a glance, whether you're comparing sales figures, performance metrics, or survey results. The taller the bar, the higher the value for that category.
When to Use a Bar Graph
Bar graphs are the best choice when you have categorical (discrete) data and want to compare values between different groups or categories.
Common use cases for bar graphs include:
Comparing sales revenue across different regions or countries
Analyzing performance metrics by department or team
Visualizing survey responses by option or demographic
Tracking monthly revenue, website traffic, or customer acquisition by channel
Comparing product performance or market share
For example, if you want to see which product is selling the most, a bar graph allows stakeholders to instantly compare performance across all products with clarity.
Bar graphs are highly flexible and can be displayed in several formats:
Vertical bar charts (most commonly used)
Horizontal bar charts (ideal when category names are long)
Grouped bar charts (to compare multiple series side by side)
Stacked bar charts (to show composition of a total)
What Is a Histogram?
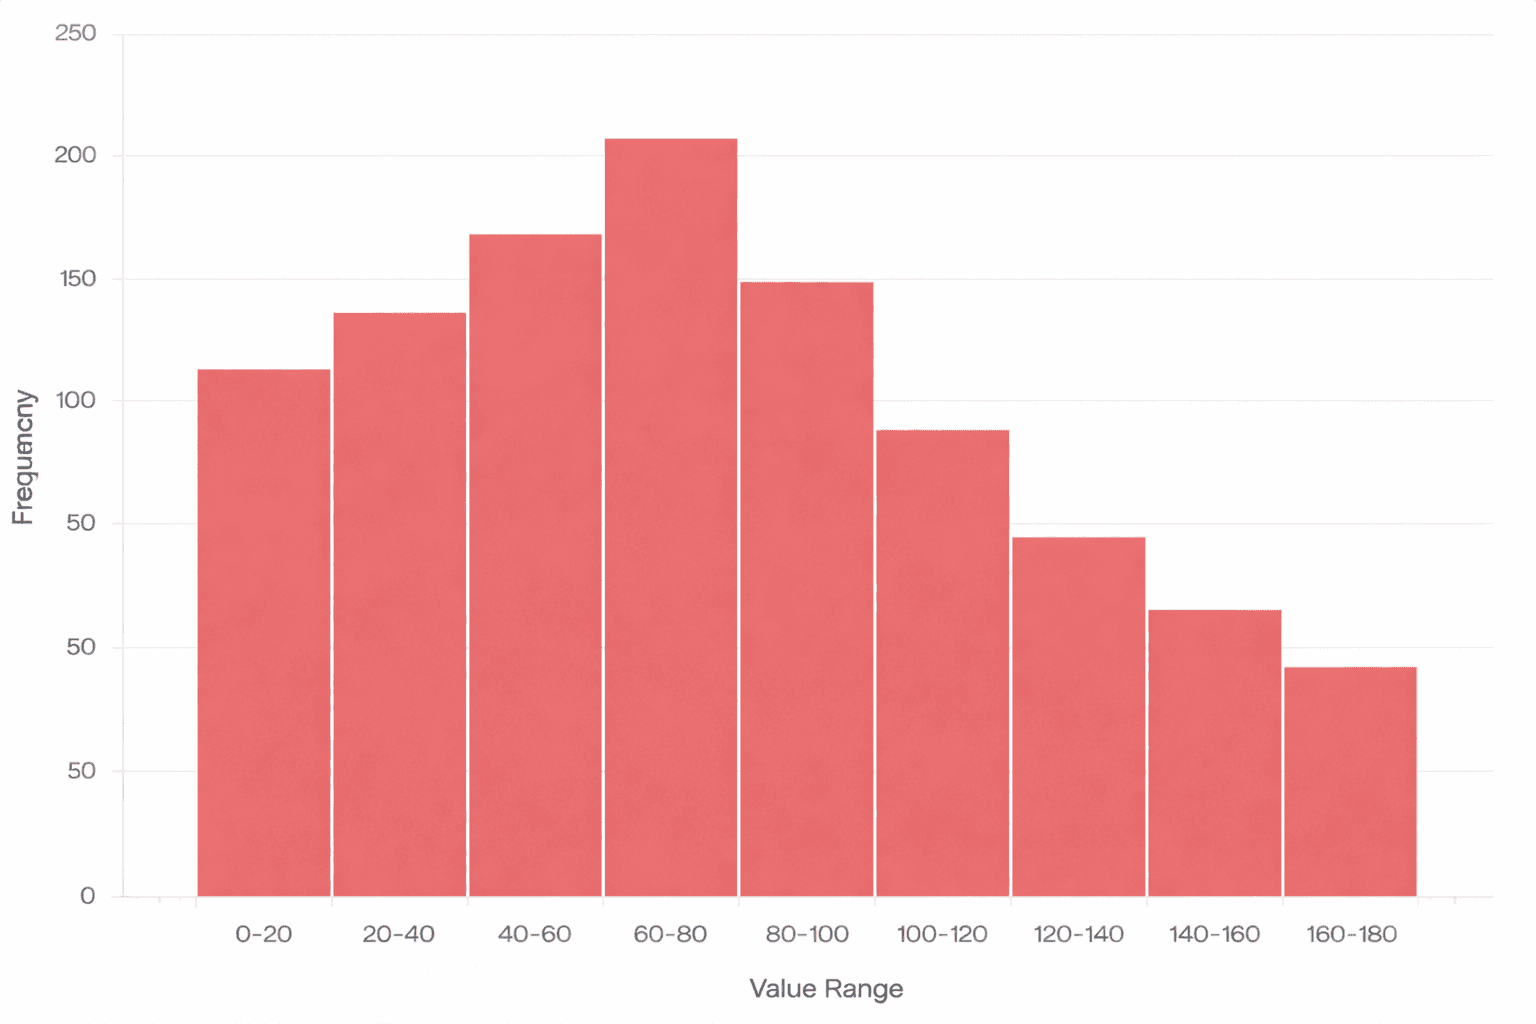
A histogram is a chart that shows the distribution of continuous numerical data. It divides the data into equal intervals called bins. Each bar represents the number of data points that fall into that interval.
The bars in a histogram touch each other with no gaps. This design shows that the data is continuous and can take any value within a range.
A histogram helps you see the shape of your data. It reveals whether the values are evenly spread, clustered in one area, skewed to the left or right, or contain outliers. These patterns are often hidden when you only look at averages.
When to Use a Histogram
Use a histogram when you have continuous numerical data and want to understand how the values are distributed across a range.
Common use cases include:
Analyzing customer age distribution
Understanding order value or spending ranges
Measuring response times or load times
Evaluating test scores or performance ratings
Detecting outliers in datasets
For example, a histogram can show whether most customers spend in the low, medium, or high price range. It helps you see the overall pattern in the data.
Histograms are not meant for comparing separate categories. If you want to compare discrete groups like sales by region or products, use a bar graph instead.
Think of it this way:
If you can name each bar (Product A, Region B, Plan C), you are looking at a bar graph.
If each bar represents a number range (0–10, 10–20, 20–30), you are looking at a histogram.
A simple way to tell the difference is by rearranging the bars. If shuffling them still makes sense, it’s a bar graph; if it breaks meaning, it’s a histogram. Bar graphs compare categories, while histograms show how values are distributed across ranges, making patterns in data easier to understand.
Histogram vs Bar Graph: Key Differences
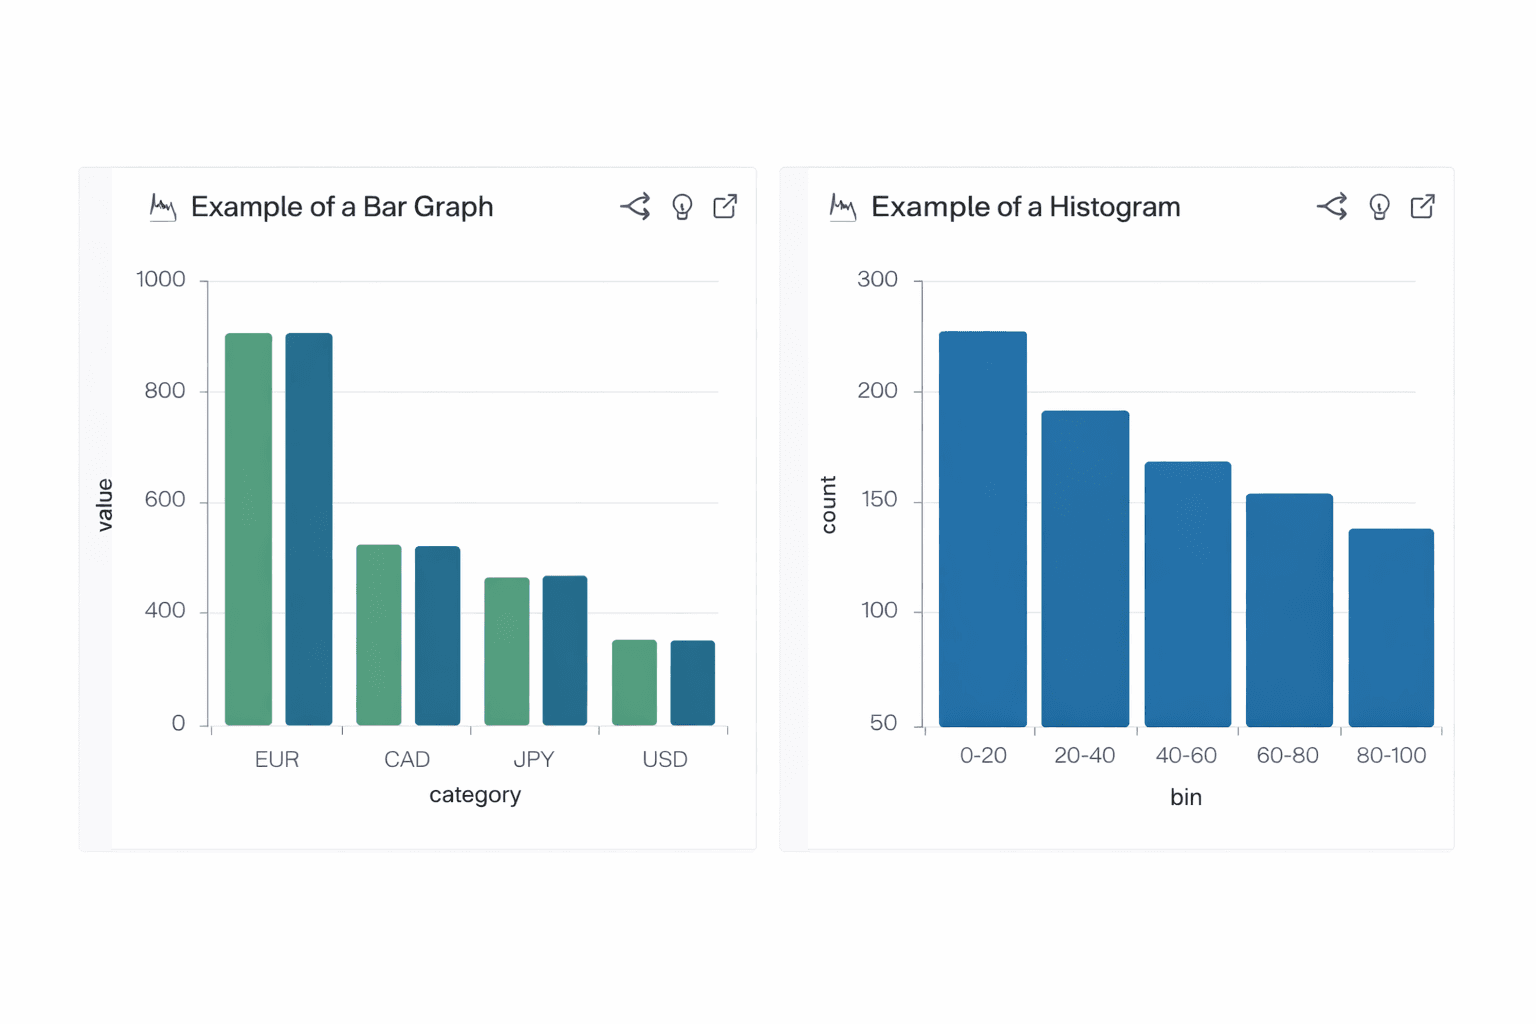
The main difference between a histogram and a bar graph is the type of data they are designed to show and the purpose they serve.
A bar graph compares values across distinct categories. A histogram shows how continuous numerical data is distributed across ranges.
For a straightforward academic explanation of the core differences, see this guide from the University of Wisconsin: University of Wisconsin’s clear explanation of bar graphs vs histograms.
Here is a clear comparison:
Histogram vs Bar Graph – Key Differences
Feature | Bar Graph (Bar Chart) | Histogram |
|---|---|---|
Data Type | Categorical (discrete groups) | Continuous (numerical data) |
Purpose | Compare values between categories | Show distribution of data |
Bars Represent | Individual category values | Frequency within ranges (bins) |
Bar Spacing | Gaps between bars | Bars touch each other (no gaps) |
Order of Bars | Can be rearranged any way | Must follow numerical order |
X-Axis | Category names (products, regions) | Numeric intervals or ranges |
Best Use Case | Sales by region, performance by team | Age distribution, order value ranges |
Every Difference Explained in Simple Terms
Data Type: Bar graphs work with categorical data such as products, regions, or departments. Histograms work with continuous data such as age, time, revenue, or test scores.
Bar Spacing: In a bar graph, bars have gaps because each category is separate. In a histogram, bars touch each other because the data flows continuously across ranges.
Ordering: You can sort or rearrange bars in a bar graph (for example, from highest to lowest). In a histogram, the bars must stay in numerical order.
Analytical Goal: Bar graphs help you compare different groups and spot which one is higher or lower. Histograms help you see the overall shape of the data and find patterns, clusters, or outliers.
"source: Storytelling with Data"
Real Business Use Cases
In real-world analytics, the bar graph vs histogram choice directly impacts how insights are understood. A bar graph is used to compare performance across categories, such as sales by region, users by plan, or revenue by product.
A histogram is used to analyze how data behaves across ranges, such as customer age distribution, order value ranges, or response times. It reveals patterns that category comparisons often miss.
For example, a retail team used a bar graph to compare average order value and saw stable performance. But after switching to a histogram, they discovered most customers were clustered in lower ranges, with a few high-value outliers skewing results, changing their strategy. Similar insights are discussed in data-driven decision-making research.
In dashboards, bar graphs support monitoring and reporting, while histograms enable deeper analysis and pattern detection. Lucidchart’s explanation of histogram vs bar graph
Common Mistakes to Avoid When Choosing Between Bar Graph and Histogram
Many people make the same mistakes when deciding between a bar graph and a histogram. These errors can hide important insights and lead to wrong conclusions.
Here are the most common mistakes:
Using a bar graph for continuous data This hides important patterns such as skewness, peaks, clusters, and outliers. The gaps between bars make the distribution harder to see.
Using a histogram for categorical data This makes comparison between categories confusing and less clear. Since the bars touch each other, it becomes difficult to quickly compare individual groups.
Choosing a chart based on habit instead of data type Many users pick the chart they are most familiar with rather than the one that best matches their data. This often happens in dashboards and reports.
Avoiding these mistakes is important. Choosing the right chart between a bar graph and a histogram helps you present data clearly, reveal true insights, and support better decision-making.
Best Tools to Create Bar Graphs and Histograms
Choosing the right chart type is important, but using the right tool is equally critical. The platform you choose can either help you avoid mistakes in bar graph vs histogram selection or make them more likely.
While many tools let you manually create charts, modern BI platforms can intelligently recommend the best visualization based on your actual data.
Why Use Supaboard for Creating Bar Graphs and Histograms
Supaboard is built to make data visualization faster and more accurate for analytics, product, and business teams.
Instead of manually struggling with histogram vs bar graph decisions, Supaboard analyzes your data and automatically suggests the most appropriate chart, whether it’s a bar graph for category comparisons or a histogram for distribution analysis.
Key advantages of using Supaboard:
Automatically detects data type and recommends the right chart (bar graph or histogram)
Create professional dashboards in minutes without writing SQL or code
Designed specifically for business and product teams who need fast, accurate insights
Reduces common visualization errors that often occur in traditional tools
Supports both categorical comparisons and continuous data distribution analysis seamlessly
Clean, interactive visualizations that are easy to share and understand
Whether you need to compare sales performance across regions using bar graphs or analyze customer age distribution with histograms, Supaboard helps you choose and create the right chart quickly and confidently.
Try Supaboard
If you want to create better dashboards and avoid common histogram vs bar graph mistakes, try Supaboard with your own data and see how it simplifies analysis.
Start your 14-day free trial and build your first dashboard in minutes, or Book A Demo
Frequently Asked Questions (FAQ)
What is the difference between a histogram and a bar graph?
The main difference between a histogram and a bar graph lies in the type of data and purpose. A bar graph compares distinct categories (like sales by region) with gaps between bars. A histogram shows the distribution of continuous numerical data (like customer age) with bars that touch each other. Bar graphs are for comparison, while histograms reveal patterns, spread, and outliers.
When should I use a bar graph vs a histogram?
Use a bar graph when comparing categorical data such as products, regions, teams, or departments. Use a histogram when analyzing how continuous data is distributed across ranges, such as age, revenue, order value, or response time. The choice depends on whether your goal is comparison or distribution analysis.
Is a histogram the same as a bar chart?
No. Although they look similar, a histogram and a bar chart (bar graph) are different. Histograms are for continuous data with touching bars, while bar charts are for categorical data with gaps between bars. Using them interchangeably can lead to misleading interpretations.
Why do the bars in a histogram touch while bar graph bars have gaps?
Histogram bars touch because they represent continuous data ranges. Each bin connects to the next, showing that values flow continuously. Bar graph bars have gaps to clearly separate independent categories.
How do I choose the right bin size for a histogram?
There is no single ideal bin size. Start with your tool’s automatic binning, then adjust based on the data. Too few bins can hide important patterns, while too many bins create noise. The goal is to clearly reveal the shape and distribution of the data without distortion.
Can I use a bar graph to show frequency distribution?
A bar graph can show frequency only for categorical data. It should not be used for continuous numerical ranges because it cannot properly show distribution patterns like skewness, clusters, or outliers, a histogram is better for that.
What chart should I use to show data distribution?
A histogram is the best chart for showing data distribution. It groups continuous values into ranges and displays frequency, making it easy to spot patterns, variability, clusters, and outliers.
Why use a histogram instead of a bar graph?
Use a histogram when you need to understand the shape and spread of continuous data. It reveals insights such as skewness, peaks, and outliers that a bar graph cannot show effectively.
Conclusion
Understanding the difference between a bar graph and a histogram is one of the most important fundamentals of data visualization. Bar graphs are excellent for comparing categories, while histograms reveal the true distribution, patterns, and outliers in continuous data.
Using the wrong chart can distort insights, mislead stakeholders, and result in poor decisions, even when the underlying data is accurate.
By correctly matching the chart to your data type and goal, you make your analysis clearer, your reports more trustworthy, and your decisions more effective.
Modern tools like Supaboard take this even further by automatically recommending the right visualization, so teams can focus on insights instead of struggling with chart selection.
Start applying these principles today and turn your data into clear, actionable intelligence.


