
What is White Label Analytics? Benefits, Examples & Tools (2026)
White label analytics explained with benefits, tools, and examples. See how to build a native analytics experience inside your product.


Great companies don’t just build products, they build experiences. And today, that experience is heavily shaped by how well you deliver insights. Yet many businesses still rely on third-party tools for reporting, creating a disconnected user journey. That’s why white label analytics is rapidly gaining traction, especially as more SaaS platforms and agencies move toward embedded analytics and white label dashboards to keep users inside their own ecosystem.
Instead of sending users elsewhere, companies are adopting white label BI tools and white label analytics platforms to deliver fully branded, seamless reporting. Whether it’s customer-facing analytics in a SaaS product or performance dashboards for clients, users now expect insights to feel native. This shift isn’t just about UX, it directly impacts engagement, retention, and perceived product value.
But here’s the part most guides miss. While researching community discussions, one pattern kept coming up: dashboards are the easy part. The real challenge in white label analytics setups is maintaining consistency, keeping metric definitions stable, preserving context over time, and ensuring decisions are tied to ownership, not just reports. Most failures happen due to definition drift, where the same metric starts meaning different things, and trust in data breaks down.
The teams that get this right treat analytics as core product infrastructure, not just a reporting layer. And that’s exactly where modern white label analytics software and embedded dashboards are evolving, helping businesses scale insights without losing consistency or trust.
In this guide, we’ll break down how white label analytics, dashboards, and BI tools work, why they matter, and how to choose the right platform for your needs.
What is white label analytics?
White labeling lets businesses rebrand a third-party product as their own, making it possible to deliver value without building technology from scratch. In analytics, this means offering customized dashboards, reports, and data tools under your own brand, while the backend is managed by a separate platform.
For agencies and SaaS companies, this unlocks clear advantages: save months of development time, scale faster, and deliver better client experiences. Instead of building analytics infrastructure, teams can focus on insights, storytelling, and product value.
With features like branding control, embedded workflows, and client-specific views, white label analytics turns reporting into a seamless, productized experience, without the overhead of building it in-house.
What part of analytics can you white label?
A common mistake is thinking white label analytics is just about dashboards. In reality, you’re building a complete data experience layer inside your product, one that feels native, branded, and scalable.
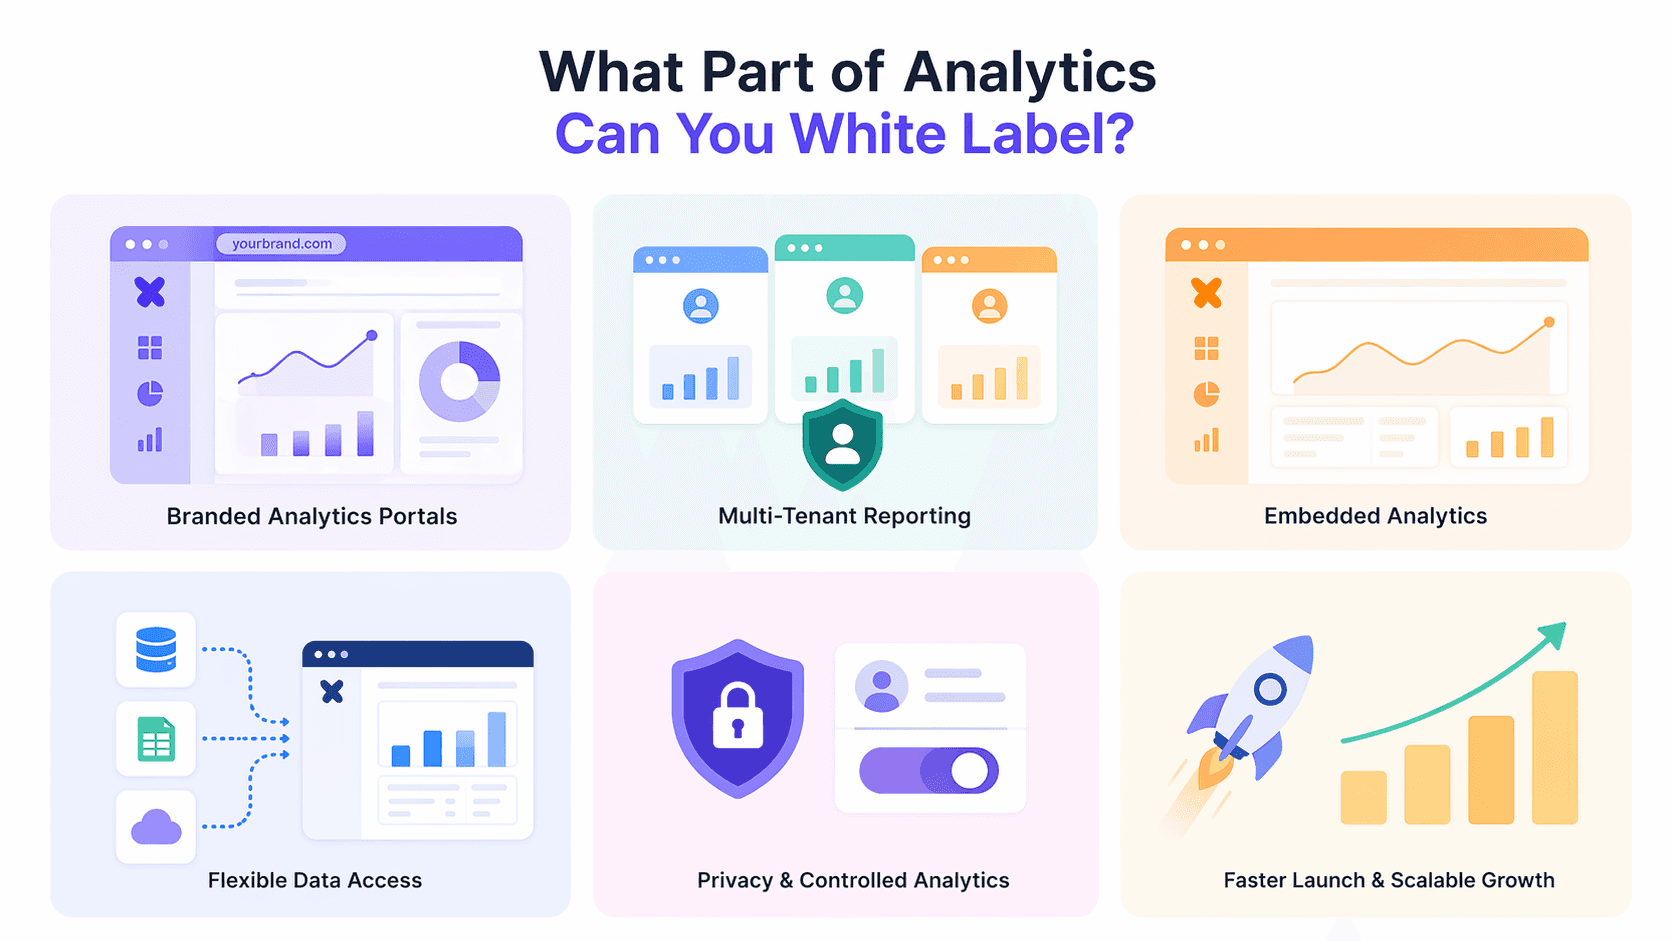
Here are the most impactful parts you can actually white label:
Branded analytics portals
One of the biggest advantages is the ability to create a fully branded analytics environment. Instead of sending users to third-party tools, you can host dashboards under your own domain with your own UI and authentication.
In practice, this means users log into your product, access their data, and never feel like they’re interacting with an external platform. This sense of ownership significantly improves trust and strengthens your brand.
Multi-tenant reporting (for SaaS & agencies)
If you're serving multiple clients, multi-tenancy becomes essential. White label analytics enables you to create isolated data environments for each customer, all managed from a single backend.
This allows you to:
Ensure each client only sees their own data
Maintain one centralized system
Scale without duplicating infrastructure
For SaaS companies and agencies, this is what makes analytics scalable and operationally efficient.
Embedded analytics inside your product
White label analytics goes beyond portals—it’s about embedding insights directly into your product workflows.
Instead of redirecting users to external BI tools, you integrate dashboards, reports, and insights within your application. This reduces friction, improves engagement, and makes analytics feel like a native product feature rather than an add-on.
Flexible data access & integrations
A strong white label setup gives you control over how data is connected, structured, and delivered.
You can integrate multiple data sources and define how different users interact with that data. In more advanced setups, teams build custom data layers or adapters to support different client needs—especially useful in enterprise or highly customizable SaaS environments.
Privacy-first and controlled analytics
As analytics becomes more embedded and client-facing, data privacy becomes critical.
Modern white label systems prioritize:
Controlled access and permissions
Secure data segmentation
Privacy-conscious tracking approaches
This ensures compliance while maintaining trust across multiple users and clients.
The real advantage: speed and scalability
Beyond features, the biggest advantage of white label analytics is how it transforms your ability to scale.
Instead of building analytics infrastructure from scratch, teams can:
Launch faster
Focus on customer acquisition
Scale reporting across clients without rebuilding
In practice, success doesn’t come from dashboards alone—it comes from speed, consistency, and the ability to deliver analytics as a product.
What makes a good white-label analytics experience?
Adding analytics is easy. Making it actually useful and used is where most teams struggle. The difference isn’t the tool itself, but how well the experience fits into your product, your users’ workflows, and your overall business context.
A truly native product experience: The biggest mistake companies make is embedding analytics that feels external. When the UI looks different, navigation breaks, or workflows change, users immediately notice the disconnect. A strong white label experience blends seamlessly into your product, so much so that users never feel like they’ve left. This continuity is what drives engagement and makes analytics feel like a natural extension of your product.
Designed for real users, not analysts: Most users interacting with your product are not data experts, and they shouldn’t have to be. A good analytics experience simplifies complexity, offering intuitive interfaces and clear insights without requiring technical knowledge. This aligns with the broader shift toward data democratization, where decision-making is distributed across teams rather than centralized with analysts.
Performance that builds trust: Speed plays a critical role in how users perceive analytics. If dashboards are slow or laggy, users quickly lose confidence and stop relying on them for decisions. On the other hand, fast and responsive systems build trust over time. When users can access insights instantly, analytics becomes something they depend on—not something they avoid.
Built around workflows, not just data: One of the most important insights from real-world implementations is that analytics alone isn’t enough. The most effective setups are designed around workflows, helping users take action, not just observe metrics. Whether it’s tracking churn, reviewing performance, or making approvals, analytics should support real decisions inside the product, not exist as a passive reporting layer.
Clear focus on use case and audience: Strong white label analytics implementations are rarely generic. Teams that succeed usually focus on a specific industry, user group, or problem, and design analytics around that context. Instead of offering broad dashboards, they solve targeted problems like improving retention or optimizing campaigns. This clarity makes the product easier to adopt and more valuable to users.
Strong governance and consistency: As analytics scales across users and clients, maintaining consistency becomes essential. Without clear definitions and structured data models, metrics can start to mean different things to different users. Over time, this erodes trust. A well-designed system ensures stable definitions, controlled access, and consistent data, so users can rely on what they see.
The reality - execution matters more than tools: Most white label analytics implementations fail not because of the technology, but because of poor execution. Inconsistent quality, unclear requirements, or weak integration can quickly turn analytics into a burden rather than a benefit. Teams that succeed treat it as a core product layer, with clear ownership, strong alignment, and continuous improvement, rather than a quick add-on.
Why Use White Label Analytics?
White label analytics helps businesses deliver powerful data experiences without the complexity of building everything from scratch. It’s less about dashboards and more about enabling faster execution, better branding, and scalable growth.
Faster launch with lower cost: Building analytics infrastructure takes time and resources. With white label analytics, you can skip the heavy development work and launch quickly using a ready-made foundation. This allows you to validate ideas faster and start delivering value without long engineering cycles.
Strong branding and ownership: White label analytics lets you fully control the user experience by keeping everything under your brand. Dashboards, portals, and reports live within your product, not on external tools. This creates a seamless experience for users and strengthens trust over time.
Built to scale across clients: As your business grows, managing analytics for multiple users or clients becomes complex. White label solutions are designed for scale, allowing you to create isolated environments for each client while managing everything centrally. This makes it easier to expand without rebuilding systems.
Focus on growth, not infrastructure: Instead of spending time maintaining analytics systems, your team can focus on what matters most, acquiring customers, improving your product, and driving outcomes. In practice, this shift in focus is what helps businesses grow faster and operate more efficiently.
White label analytics vs Embedded analytics
Aspect | White label analytics | Embedded analytics |
|---|---|---|
Branding | Fully rebranded experience. No vendor UI, logos, or URLs visible to end users. | Vendor branding may still be visible depending on the tool and implementation. |
Experience | Feels completely native to your product. Users stay in your ecosystem end-to-end. | Integrated into your app, but may still feel like a third-party layer. |
Control | Full control over UI, workflows, permissions, data models, and even URLs/domains. | Limited control. Customization depends on vendor SDKs, APIs, and predefined layouts. |
Purpose | Built for product differentiation and owning the entire data experience. | Designed to add analytics capabilities quickly without building from scratch. |
Before vs after: white label analytics vs embedded analytics in real workflows
1. Marketing team working with campaign data
Before: Exporting CSVs, building charts in Excel, and preparing weekly reports manually.
With embedded analytics:
Marketing views dashboards inside your app, but customization is limited. Some workflows still depend on predefined templates or external BI logic.With white label analytics:
They ask, “Which campaign drove the highest LTV this month?” and get a fully branded, interactive chart directly inside your product—with filters, drill-downs, and no visible third-party layer.
2. Customer success team analyzing churn
Before: Exporting churn data, switching between tools, and explaining insights over calls.
With embedded analytics:
CS teams access dashboards within your product, but deeper analysis may still require switching tools or relying on prebuilt views.With white label analytics:
CS managers explore churn by segment, region, or plan using a fully integrated dashboard that feels native to your product no tool switching, no vendor friction.
How Supaboard Delivers White Label Analytics That Users Actually Use
Most analytics tools get added to products, but rarely get used. They often feel slow, complex, and disconnected from the actual workflow.
Supaboard takes a different approach by focusing on usability first.
Instead of making users navigate dashboards or build reports, Supaboard lets them simply ask questions in natural language and get instant, clear answers. The system automatically generates the right charts and dashboards based on what the user is trying to understand.
Here’s what makes it different:
Ask questions, not build dashboards – Users just type what they want to know
Instant dashboards – No setup, no waiting, no manual work
Fully white-labeled – Matches your product experience seamlessly
Real-time insights – Always up-to-date, not static reports
Easy exploration – Drill down and filter data without complexity
Minimal engineering effort – No need to build analytics from scratch
For teams, this means faster implementation and less maintenance.
For users, it means quicker answers and better decisions.
Supaboard doesn’t just add analytics to your product, it makes it something users actually rely on. Try it now
Know More About "Supaboard"
Frequently Asked Questions
Who should use white label analytics?
White label analytics is ideal for SaaS platforms, agencies, and data-driven products that need to deliver insights directly to users. It allows businesses to embed white label dashboards and analytics tools inside their product while maintaining full branding.
It’s especially useful for:
SaaS products with customer-facing analytics
Agencies offering client reporting dashboards
Platforms looking to improve retention with embedded analytics
By using a white label analytics platform, companies can turn data into a core product feature instead of relying on external BI tools.
When should you NOT use white label analytics?
You should avoid white label analytics if your product has low data usage or lacks a clear need for user-facing insights. Early-stage products without stable data pipelines may find it unnecessary to invest in full-scale white label dashboards or embedded analytics.
In these cases, starting with simple reporting or basic dashboards is more practical before scaling to a full white label analytics solution.
What are the best white label analytics tools in 2026?
The best white label analytics tools in 2026 focus on embedded analytics, real-time performance, and ease of use. Instead of just dashboards, modern tools offer AI-powered insights, natural language queries, and fully customizable white label experiences.
When choosing a white label analytics platform, look for:
Strong branding and customization
Embedded analytics (API, SDK, iframe support)
Real-time data capabilities
Simple UX for non-technical users
The right tool depends on how deeply you want analytics integrated into your product.
What are common mistakes in implementing white label analytics?
The biggest mistake is treating white label analytics as a feature instead of a core product experience. If dashboards feel disconnected or difficult to use, adoption drops quickly.
Other common mistakes include:
Poor UI integration that feels external
Slow or non-real-time dashboards
Overcomplicated analytics for non-technical users
Lack of clear use cases or business goals
Successful implementations focus on usability, speed, and clarity—ensuring their white label dashboards and analytics tools actually drive decisions.
What is the difference between white label analytics and embedded analytics?
Embedded analytics focuses on integrating dashboards and reports into a product, while white label analytics goes a step further by fully customizing the experience to match your brand.
In simple terms:
Embedded analytics = adding analytics to your product
White label analytics = owning the entire analytics experience
Most modern platforms combine both, offering embedded white label dashboards with full branding and customization.
Final Takeaway
White label analytics isn’t just about adding charts or dashboards to your product, it’s about redefining how users interact with data. When done right, white label analytics platforms and embedded dashboards become a natural part of the product experience, not a separate layer.
Instead of switching tools, waiting for reports, or relying on analysts, users can access real-time insights directly within your application. They ask questions, explore data, and make decisions instantly, without friction. This is the real shift: from passive reporting to active, in-product decision-making.
The biggest advantage of white label dashboards and BI tools isn’t just better visuals—it’s ownership. You control the entire data experience, from branding to workflows to insights. And when analytics is fully integrated, it stops being an add-on and becomes a core part of your product’s value.


