
What Is Data Connectivity? How It Works + Real Examples
Understand data connectivity, how it works, and how businesses use it to unify data, improve decisions, and unlock real-time insights.


Introducution
Most teams don’t struggle with data because they lack tools, they struggle because their data is disconnected.
Your CRM tells one story. Your analytics platform shows another. Your data warehouse holds everything, but accessing it takes time, technical skills, and constant back-and-forth. The result? Slower decisions, bottlenecks, and missed opportunities.
Data connectivity solves this problem.
At its core, data connectivity is the ability to connect different systems, applications, and databases so data can flow between them seamlessly, often in real time. It ensures that the data you need is accessible, consistent, and ready to use across your entire stack.
In practice, data connectivity is what turns fragmented data into a unified, actionable source of truth, enabling teams to move from guesswork to confident, data-driven decisions.
In this guide, you’ll learn what data connectivity is, how it works, key use cases, and how modern teams use it to operate faster and smarter.
What Is Data Connectivity?
Data connectivity is the ability to connect systems, applications, and data sources so they can share, access, and sync data seamlessly across an organization. It ensures that data flows between platforms in a consistent, reliable, and often real-time way.
In practical terms, data connectivity allows businesses to integrate data from tools like CRMs, databases, cloud applications, and internal systems, so teams can work from a single, unified source of truth.
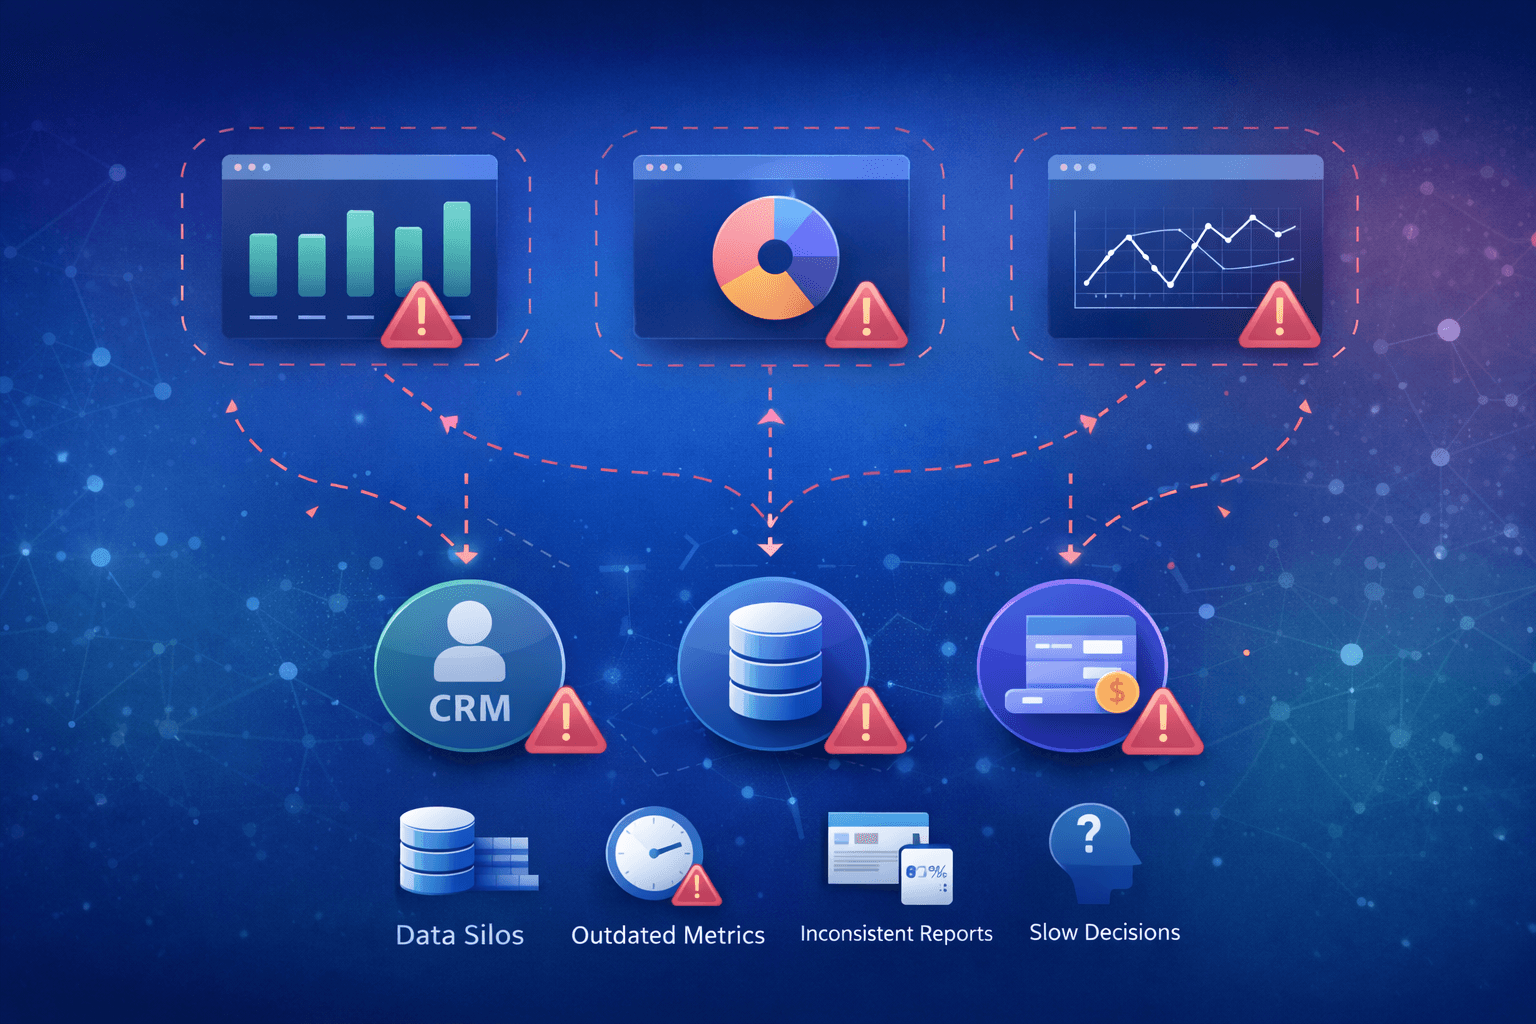
Today, organizations generate vast amounts of data from every customer interaction, including website activity, purchases, and support conversations. However, this data is typically scattered across multiple disconnected systems. The result is data silos, inconsistent reporting, slower decision-making, and operational inefficiencies.
Data connectivity solves this by enabling a continuous, automated flow of information between systems. It brings together data from different sources, making it easier to power analytics, automate workflows, and build a complete, accurate view of customers and operations.
You can think of data connectivity as a digital highway, where information moves freely between systems instead of getting stuck in isolated platforms. When data is connected, teams gain instant access to reliable insights and can make faster, more confident decisions.
Why Traditional BI Without Connectivity Falls Short
Traditional BI without data connectivity falls short because it relies on static, siloed, and delayed data, making it ineffective for real-time decision-making.
Legacy BI systems often depend on batch processing and disconnected data sources, which creates high latency and outdated insights. Without direct data connectivity, these tools struggle to unify information across departments, leading to inconsistent metrics and conflicting reports.
Another major issue is manual data handling. Teams often export, clean, and merge data manually, which increases the risk of errors, consumes valuable time, and makes reporting inefficient.
Traditional BI systems also lack real-time visibility. Since data updates are delayed, businesses cannot respond quickly to changes such as customer behavior, revenue fluctuations, or operational issues.
Additionally, these systems face scalability challenges. As organizations adopt more tools and generate more data, disconnected BI setups become harder to maintain, slower to update, and more expensive to scale.
As data environments grow more complex and dynamic, traditional BI systems lack the flexibility to adapt. This results in slower decisions, reduced data trust, and missed business opportunities.
Key limitations of traditional BI
Traditional BI systems struggle without data connectivity, leading to delayed insights, fragmented data, and limited decision-making capabilities.
1. Latency and Outdated Data
Traditional BI relies on batch processing (daily or weekly updates), meaning decisions are often based on outdated information rather than real-time insights.
2. Data Silos and Fragmentation
Disconnected systems prevent data from being unified across sources like CRM, ERP, and analytics tools. This results in incomplete visibility and fragmented business insights.
3. Inconsistent Metrics Across Teams
Without a shared data layer, teams define KPIs differently. This leads to conflicting dashboards, misalignment, and reduced trust in data.
4. Manual Work and Bottlenecks
Traditional BI often depends on analysts or IT teams to prepare data and generate reports, slowing down access and creating operational bottlenecks.
5. Lack of Real-Time and Proactive Insights
These systems are designed for historical reporting—showing what happened, not what is happening or what will happen—making decision-making reactive instead of proactive.
6. Limited Flexibility and Scalability
As data grows across tools and platforms, traditional BI systems become harder to maintain, slower to update, and expensive to scale.
7. Poor Handling of Modern Data Types
Traditional BI tools are optimized for structured data (like SQL databases) and struggle to process unstructured data such as logs, social media, audio, or video.
8. Restricted Data Access (Poor Data Democratization)
Complex interfaces and rigid data models limit access to technical users, preventing non-technical teams from independently exploring data.
Why This Matters
When systems are not connected, the core purpose of BI breaks down. A single source of truth becomes nearly impossible, leading to confusion, slower decisions, and reduced confidence in data.
The Hidden Cost of Poor Data Connectivity
Poor data connectivity is a growing business risk, limiting real-time data access, slowing decision-making, and reducing operational efficiency. When systems remain disconnected, organizations face data silos, inconsistent insights, and missed revenue opportunities. In today’s data-driven environment, lack of data connectivity directly impacts analytics performance, customer experience, and business growth, making unified data integration critical for competitive advantage.
According to McKinsey insights on data productivity impact, poor-quality and fragmented data can reduce productivity by up to 20% and increase operational costs by 30%. Similarly, research highlighted by Gartner data quality cost analysis shows that organizations lose an average of $12.9 million per year due to poor data quality and disconnected systems.
This clearly shows that disconnected data is not just an inconvenience, it’s a measurable financial problem.
Key Hidden Costs of Poor Data Connectivity
Poor data connectivity leads to slower decisions, higher costs, and reduced business performance due to disconnected and unreliable data.
1. Slower Decision-Making: Scattered and delayed data prevents teams from accessing real-time insights, leading to missed opportunities and slower responses.
2. Increased Manual Work and Errors: Teams spend significant time manually collecting and reconciling data, increasing inefficiencies and the risk of human error.
3. Inconsistent Insights and Loss of Data Trust: Disconnected systems create conflicting reports, causing confusion and reducing confidence in data-driven decisions.
4. Revenue Loss and Poor Customer Experience: Lack of real-time data leads to delayed responses, failed transactions, and poor customer experiences, directly impacting revenue.
5. Higher Costs and Slower Growth: Businesses incur extra costs from inefficiencies, duplicate tools, and delayed innovation, limiting scalability and growth.
How Does Data Connectivity Work?
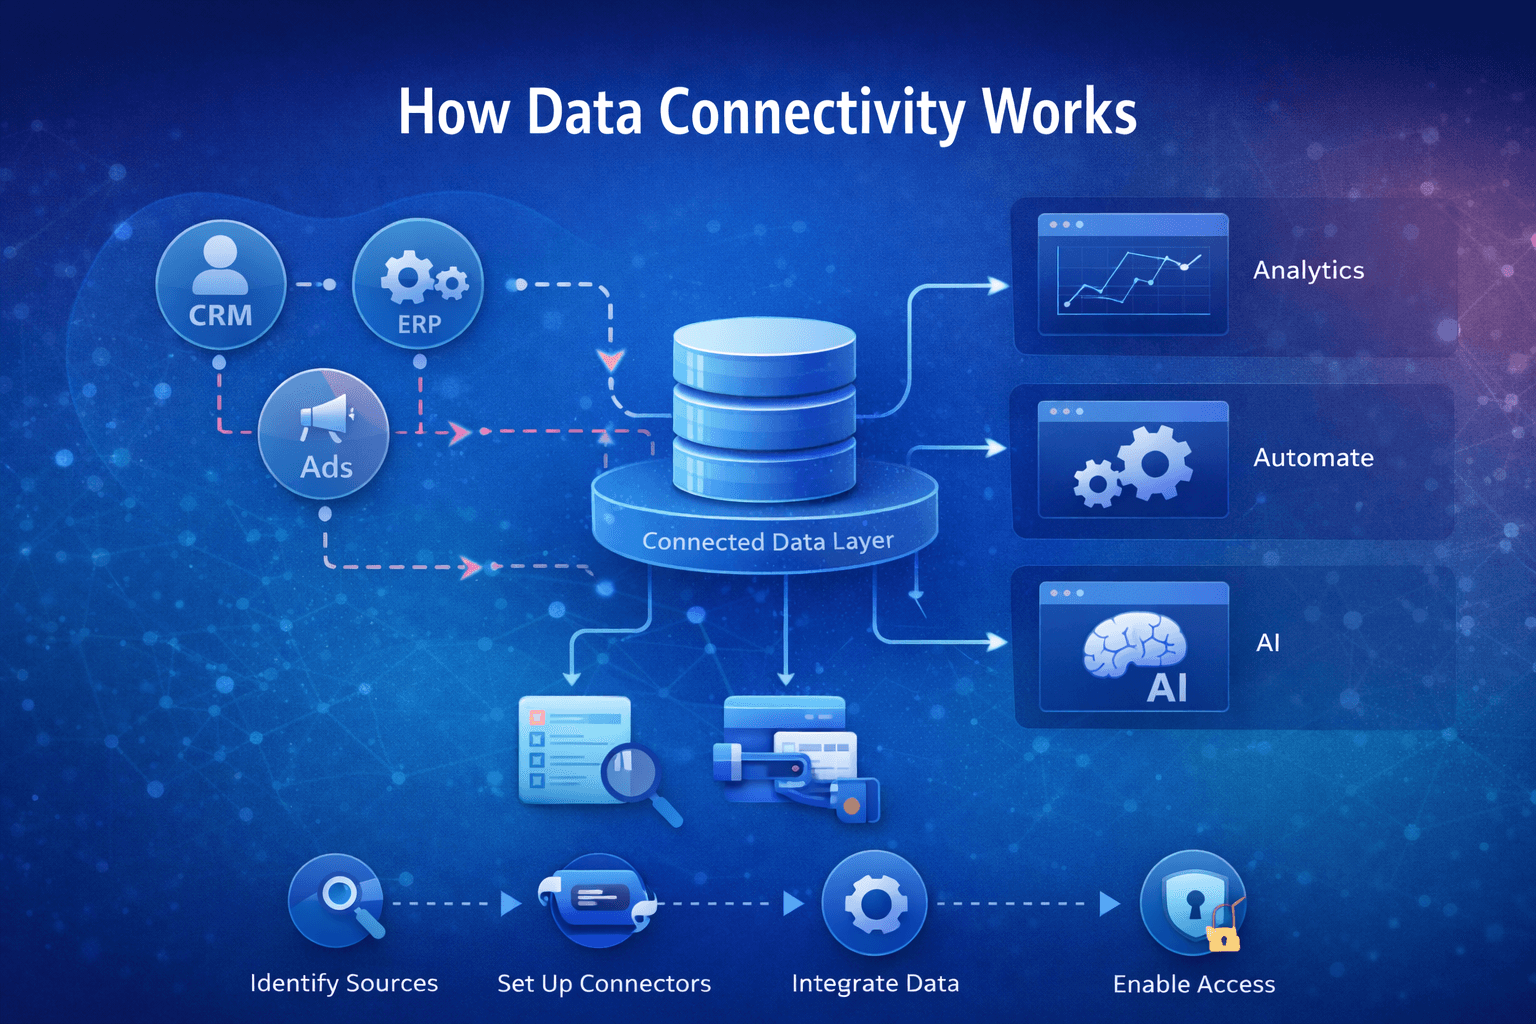
Data connectivity works by linking different data sources across an organization so information can move freely, stay consistent, and be used wherever it’s needed.
It starts with identifying where your data lives,this could include internal systems like CRM, ERP, finance tools, and databases, as well as external platforms such as ad networks, payment gateways, or partner applications. In most businesses, this data is spread across multiple tools, which is why connectivity becomes essential.
Once the sources are identified, systems are connected using APIs, data connectors, or integration platforms. Tools like MuleSoft provide pre-built connectors that act like bridges, allowing data to move between systems without manual effort.
Step-by-Step Breakdown
1. Data Sources
Data is generated across multiple systems—CRM, product analytics, marketing tools, databases, and more.
2. Connectors and APIs
APIs and connectors act as “on-ramps,” enabling systems to communicate and exchange data securely.
3. Data Movement and Processing
Data is transferred in real time or batches into a central layer such as a data warehouse, lake, or processing system.
4. Unified Data Layer
All data is standardized and organized into a consistent format, making it easier to access and analyze.
5. Consumption and Usage
Connected data is then used in dashboards, analytics tools, or AI systems to generate insights, automate workflows, and support decision-making.
Think of data connectivity as a network where multiple systems plug into a single, trusted layer. Instead of switching between tools or relying on fragmented data, teams can access a unified view of information in one place.
This is what allows businesses to move from reactive reporting to proactive decision-making, because the data they need is always available, consistent, and ready to use.
Why Data Connectivity Is Critical for Businesses and Enterprises?
Powers Advanced Analytics and AI Models
AI systems need unified, high-quality data to work accurately. Connected data allows businesses to build better predictions, automation, personalization, and forecasting.
Example
An e-commerce company connects customer behavior, browsing history, and purchase data to power AI-driven recommendations.
Enables Faster Response to Market Changes
When data flows in real time, enterprises can detect trends, shifts in demand, or emerging risks early.
Example
A retail brand adjusts pricing and inventory instantly after spotting sudden regional demand changes.
Provides Real-Time Access Across Systems
Data connectivity ensures teams can access up-to-date data from CRM, ERP, finance, and marketing tools without delays.
Example
Sales teams view pipeline, revenue, and customer data from a single dashboard.
Strengthens Risk Management and Forecasting
Connected historical and real-time data improves anomaly detection, forecasting, and compliance.
Example
A bank connects transaction and customer data to detect fraud early and assess credit risks.
Benefits of Data Connectivity for Businesses
Data connectivity enables businesses to bring together data from multiple systems into a single, consistent view. This not only improves visibility but also helps teams make faster decisions, reduce manual work, and operate more efficiently. When data flows seamlessly across tools, organizations move from reactive reporting to proactive decision-making.
Key Benefits of Data Connectivity
Informed Decision-Making: When data from sales, marketing, finance, and operations is connected, leaders can rely on a complete and accurate picture instead of fragmented reports. This leads to faster, more confident strategic decisions.
Example:
A CEO reviews unified performance data across departments before approving a new market expansion, reducing risk and uncertainty.Better Data Management and Governance
Connected systems reduce duplication, enforce consistency, and improve overall data quality. This makes it easier to maintain compliance, track changes, and ensure everyone is working with the same version of truth.Example:
An enterprise connects HR, payroll, and attendance systems to maintain accurate employee records without inconsistencies.Faster Data Exploration and Insights
With connected data, analysts and teams can explore patterns, test hypotheses, and generate insights without spending time on manual data preparation. This accelerates reporting and innovation.Example:
A product team combines usage data with customer feedback to quickly identify why feature adoption is declining and take corrective action.Operational Efficiency and Automation
Data connectivity eliminates repetitive manual processes by enabling automated data flows between systems. This reduces errors, saves time, and lowers operational costs.Example:
A company automates order data from its e-commerce platform into its inventory and billing systems, reducing manual entry and delays.Improved Customer Experience
When customer data is connected across touchpoints, businesses gain a unified view of interactions. This allows for more personalized communication, faster support, and better service outcomes.Example:
A support agent accesses purchase history, previous tickets, and usage data in one place to resolve issues faster.Increased Productivity and Collaboration
Teams no longer need to switch between tools or verify conflicting data. Shared access to reliable information improves collaboration across departments and speeds up workflows.Example:
Marketing and sales teams align campaigns and conversions using the same connected dataset.Agility and Competitive Advantage
Businesses with connected data can respond faster to market changes, customer behavior, and operational issues. This flexibility gives them a strong edge over competitors relying on siloed systems.Example:
A retailer adjusts inventory in real time based on live demand trends across regions.
Case Study: How a Retail Giant Transformed Decision-Making
A nationwide US retailer struggled with disconnected systems across more than 500 stores and its online platform. Reporting was slow. Visibility was limited. Teams relied on manual processes. By centralizing data, automating reporting, and enabling real-time insights through a unified data platform, the company created a single source of truth.
Results
• Reporting time reduced from days to hours
• Inventory accuracy improved by 20 percent
• Repeat purchases increased by 10 percent
With connected data, teams now respond faster, forecast better, and make confident decisions daily.
FAQs About Data Connectivity
What is data connectivity in simple terms?
Data connectivity allows different systems and tools to share and access data seamlessly. Instead of working in silos, businesses can use connected data to get a unified view across teams, improving accuracy and reducing manual work in everyday operations.
Why is data connectivity important for business intelligence (BI)?
Data connectivity in BI ensures that dashboards and reports are based on complete, real-time data. Without it, insights become fragmented or outdated. Connected systems help teams rely on accurate analytics, making it easier to track performance and make faster, data-driven decisions.
How is data connectivity different from data integration?
Data connectivity vs data integration differs in purpose. Connectivity focuses on enabling continuous data access across systems, while integration focuses on combining and transforming data into a unified format. Both work together, but connectivity ensures data flows, while integration makes it analysis-ready.
What are examples of data connectivity in business?
Common data connectivity examples include linking CRM with finance tools to track revenue, connecting marketing platforms with analytics tools for campaign performance, and syncing ERP systems with inventory databases. These connections allow businesses to access insights without switching between multiple tools.
How does AI use connected data?
AI and data connectivity work together to improve predictions and automation. When data from multiple systems is connected, AI models can analyze patterns more accurately, deliver better recommendations, and automate workflows. Poor connectivity leads to incomplete data, which reduces AI effectiveness.
What happens when businesses lack data connectivity?
Without data connectivity, organizations deal with data silos, slow reporting, and manual processes. Teams spend more time gathering data than analyzing it, which delays decisions and reduces efficiency. Over time, inconsistent data lowers trust in analytics and impacts business performance.
What is data connectivity technology?
Data connectivity technology includes APIs, data connectors, ETL pipelines, and integration platforms that enable systems to communicate. Tools like APIs allow real-time data exchange, while ETL pipelines process large datasets. Learn more from Salesforce.
What are the pros and cons of data connectivity methods?
Different data connectivity methods have trade-offs. APIs offer real-time data access but require maintenance. ETL pipelines handle large volumes but introduce delays. Direct connections are fast but less flexible. Choosing the right approach depends on scalability, speed, and system complexity.
What are the types of data connectivity methods?
The main types of data connectivity include API-based connectivity, batch processing (ETL), real-time streaming, and direct database connections. Each method supports different use cases based on data volume, speed requirements, and business needs.
How does data connectivity improve data quality?
Data connectivity improves data quality by ensuring consistency across systems. When data is synchronized and updated in real time, duplication and errors are reduced. This helps businesses maintain reliable datasets, which are essential for accurate reporting and decision-making.
Final Thoughts
Most businesses already have the data they need, the real advantage comes from data connectivity. When your systems are connected, data stops being fragmented and starts becoming useful. Instead of relying on manual reports or incomplete insights, teams get a clear, real-time view of what’s happening across the business, enabling faster decisions and better outcomes.
But data connectivity isn’t just about integrating tools. It’s about making data accessible and actionable for everyone — so teams can move from searching for information to actually using it. When data flows seamlessly, collaboration improves, bottlenecks disappear, and decisions become more confident and consistent.
This is where modern platforms like Supaboard make a difference. By connecting your data and allowing teams to simply ask questions, you remove the complexity of dashboards and queries and unlock instant, contextual insights. If you’re looking to improve decision-making and get more value from your data, it starts with better connectivity.
Book a demo and experience connected data in action.


