
Manual Reporting Problems in Data Teams (And How to Fix Them)
Manual reporting slows data teams, creates errors, and delays decisions. Learn the biggest manual reporting problems and how modern teams fix them.


Introduction
In today’s competitive business environment, speed, accuracy, and visibility are no longer optional, they’re essential. Yet inside many organizations, data teams still spend late evenings updating Excel sheets, fixing broken formulas, and chasing missing numbers before leadership meetings.
What looks like a simple reporting task often hides one of the biggest barriers to growth: manual reporting.
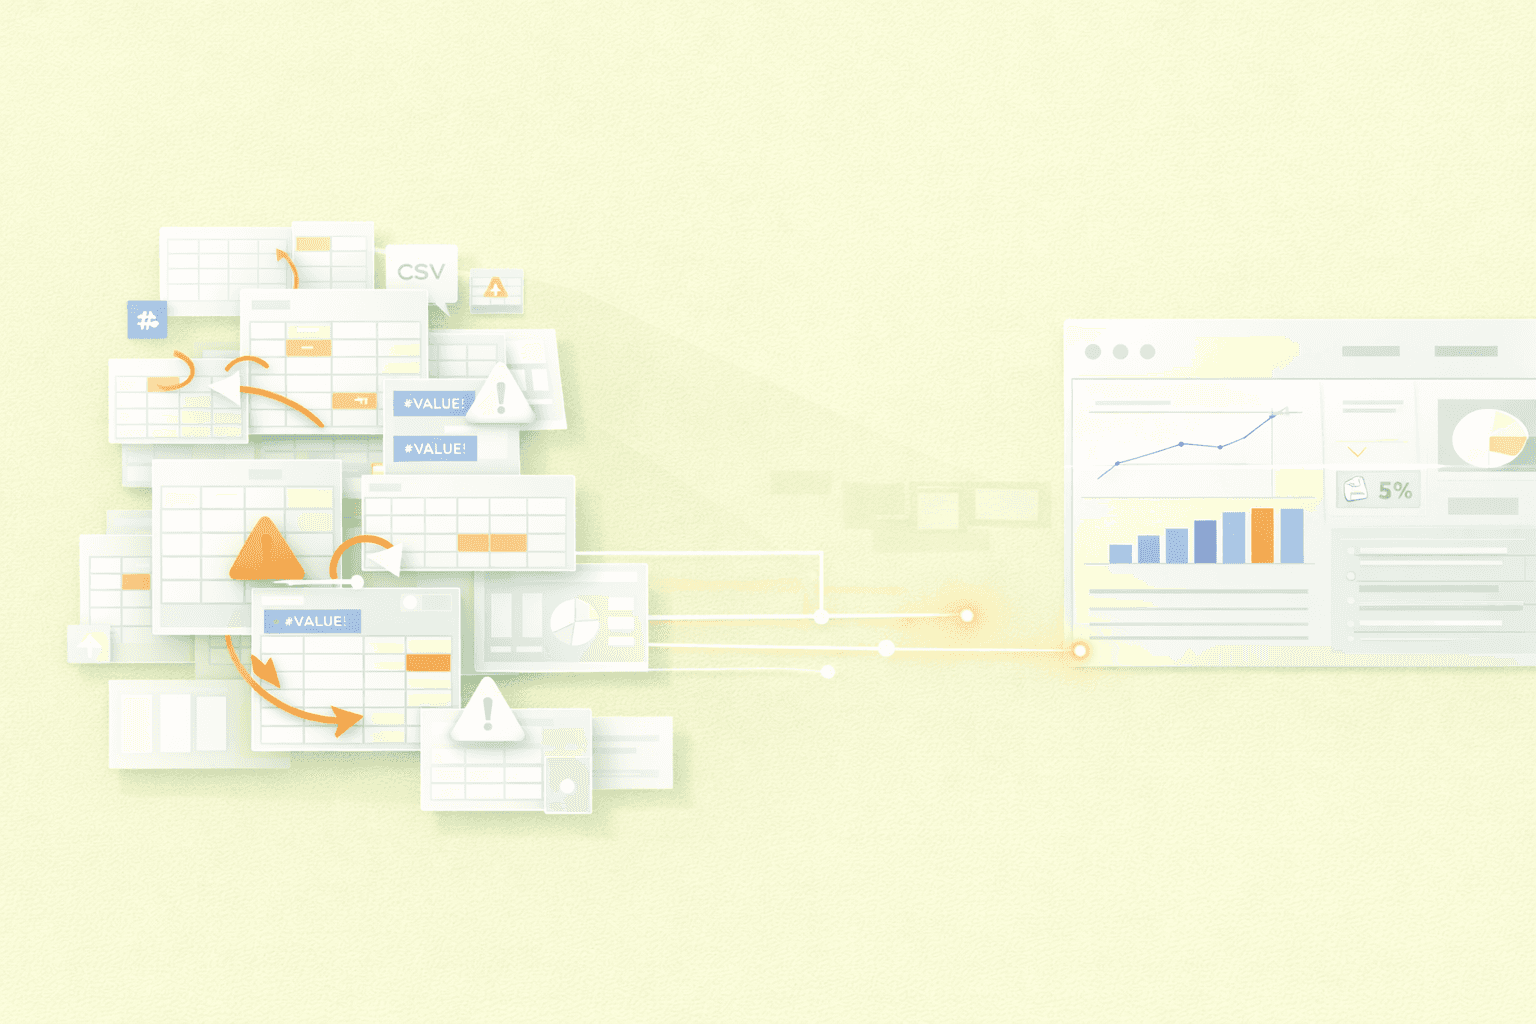
Manual reporting relies on spreadsheets, copy-paste workflows, CSV exports, and static reports. While these methods may feel familiar, they create serious manual reporting problems in data teams, slowing decision-making and draining data team productivity. Spreadsheet reporting problems don’t just waste time, they quietly damage trust in data and burn out skilled analysts.
The good news is that these issues aren’t inevitable. With better workflows, automation, and real-time dashboards, data teams can move from reporting maintenance to meaningful insight.
What Is Manual Reporting in Data Teams?
Manual reporting is any reporting workflow that depends heavily on human effort to move, clean, or update data. Typically, this means exporting data from tools like CRMs, marketing platforms, or databases, pasting it into Excel or Google Sheets, and manually preparing reports.
Common setups look like this:
CSV exports emailed every week
Google Sheets shared across teams
Excel files with fragile formulas and tabs
Static slides updated before every meeting
Teams still use manual data reporting for good reasons. Old systems don't work well together. Automation seems like it costs a lot or is dangerous. And for a while, manual reporting "worked fine" when the company was smaller.
The problem is that manual reporting issues don’t show up immediately. They grow slowly, until the system can't hold itself up anymore.
Key Manual Reporting Problems in Data Teams

1. Time-Consuming & Repetitive Work
Manual reporting consumes time in the least visible way possible, through repetition.
Every week, the same analyst:
Pulls the same data
Fixes the same formatting
Updates the same charts
Answers the same follow-up questions
At a mid-size SaaS company, analysts reported spending 40–60% of their time just maintaining recurring reports. This time-consuming reporting process leaves little room for actual analysis.
Instead of answering questions like "why did churn go up?" or "which segment is growing the fastest?" teams are stuck doing the same reporting tasks over and over again that don't give them any new information.
This is where productivity quietly dies.
2. High Risk of Errors & Data Inaccuracy
Spreadsheets don’t fail loudly, they fail subtly.
A row that was missed. A VLOOKUP that doesn't work. There are two copies of the same file called "final_v3_updated.xlsx." These kinds of mistakes happen all the time, even with experienced teams.
A real-life example:
A retail business found out that its weekly sales report had been wrong for three months because it had imported the same data twice. It wasn't a bad mistake; it was just human. But the trust in leadership was hurt.
It's not just a few cases where the data isn't correct. In workflows with a lot of spreadsheets, they are unavoidable. And once stakeholders lose faith in the numbers, they question every new piece of information.
3. Slow Decision-Making
Manual reporting creates lag, by design.
Reports are built after data is collected. By the time leadership sees them, the situation has already changed. This leads to delayed business insights and decisions based on history, not reality.
At a fast-growing startup, marketing leaders were reviewing campaign performance once a week. By the time underperforming campaigns were identified, thousands had already been wasted. This is what slow reporting looks like in practice.
Without real-time dashboards, teams operate with a lack of real-time reporting, turning data into a rearview mirror instead of a steering wheel.
4. Data Team Burnout
Perhaps the most overlooked cost of manual reporting is human.
Data analysts didn’t choose this career to copy-paste data. When weeks turn into months of low-value work, motivation drops. This leads to data team burnout, disengagement, and eventually attrition.
One fintech company lost two senior analysts in a year, not because of salary, but because “the work wasn’t meaningful anymore.”
Manual reporting doesn’t just hurt output. It hurts people. And replacing burned-out analysts is far more expensive than fixing broken workflows.
How Manual Reporting Hurts the Business
From a business perspective, manual reporting creates invisible risk.
Leadership decisions are made on outdated or incomplete data, increasing the chance of strategic mistakes. This is the real impact of manual reporting on business decisions.
Growth slows because insights arrive late. Teams hesitate to trust metrics. Scaling analytics feels painful instead of empowering. What looked like a “cheap” solution becomes a long-term liability.
This is the core manual reporting inefficiency: low upfront cost, high long-term damage.
Manual Reporting vs Automated Reporting
The difference becomes clear the moment automation is introduced.
Real example:
A weekly revenue report that once took 6 hours in Excel now refreshes automatically in seconds.
Key differences:
Speed: Manual reports are delayed; automated reports update continuously
Accuracy: Automation reduces human error and version conflicts
Scalability: Manual reporting breaks as data grows; automation scales naturally
Effort: Analysts focus on insights, not maintenance
This is why manual reporting vs automated reporting isn’t a tooling debate, it’s a maturity milestone. Automated reporting for data teams allows insight to move at the speed of the business.
Aspect | Manual Reporting | Automated Reporting |
|---|---|---|
Data Updates | Delayed, scheduled manually | Real-time or near real-time |
Accuracy | High risk of human error | Consistent and reliable |
Time Spent | Hours spent every week | Minutes or seconds |
Scalability | Breaks as data grows | Scales with the business |
Team Productivity | Focused on maintenance | Focused on insights |
Decision Speed | Reactive and slow | Proactive and fast |
Data Trust | Low confidence over time | High stakeholder trust |
How to Fix Manual Reporting Problems in Data Teams
Fixing manual reporting doesn’t mean replacing everything at once. The most successful teams improve incrementally.
1. Automate Data Collection
Connect core data sources directly to a centralized system. This removes manual exports and reduces error-prone handoffs.
2. Use Real-Time Dashboards
Replace static spreadsheets with dashboards that update automatically. Shared visibility reduces confusion and endless follow-ups.
3. Enable Self-Service Analytics
Give stakeholders access to trusted metrics so analysts aren’t bottlenecks for every question.
For teams ready to scale, modern BI tools, reverse ETL solutions, or automated reporting platforms can significantly reduce manual effort while improving reliability, without adding more analysts.
The goal isn’t just automation. It’s restoring focus, trust, and momentum.
Data are just summaries of thousands of stories - tell a few of those stories to help make the data meaningful." - Chip and Dan Heath
Frequently Asked Questions (FAQ)
1. Why is manual reporting still common in data teams?
Manual reporting feels familiar and low-cost at first. Many teams start with spreadsheets before realizing the long-term productivity and accuracy issues.
2. What are the biggest manual reporting problems in data teams?
The biggest issues include time-consuming repetitive work, high error rates, slow decision-making, and data team burnout.
3. Are spreadsheets always bad for reporting?
No. Spreadsheets work well for small, ad-hoc analysis. Problems arise when they’re used for recurring, business-critical reporting.
4. How does automated reporting improve data accuracy?
Automated reporting reduces manual data handling, version conflicts, and formula errors, ensuring consistent and reliable metrics.
5. Do data teams need advanced tools to fix manual reporting?
Not always. Even simple automation, shared dashboards, and better data workflows can significantly reduce manual effort.
6. When should a team move away from manual reporting?
When reports take hours to maintain, errors become frequent, or decisions rely on outdated data, it’s time to automate.
7. How does manual reporting affect business decisions?
Manual reporting delays insights and increases the risk of decisions based on incomplete or inaccurate data.
Conclusion
Manual reporting doesn’t fail overnight—it erodes productivity, trust, and morale over time. What starts as a quick workaround becomes a permanent drag on performance.
To truly fix manual reporting, organizations must move toward automated, real-time, and scalable reporting workflows. This shift frees data teams to do what they do best: think, analyze, and guide decisions.
That’s how modern data teams turn reporting from a burden into a strategic advantage.
For teams evaluating automated reporting or real-time dashboards, the key is choosing tools that reduce manual work without adding operational complexity.


