

Supaboard and Metabase are two of the most popular business intelligence tools that many organizations rely on for their BI needs. Both platforms offer a wide range of features and capabilities, making it challenging to choose between the two. In the Supaboard vs Metabase comparison, Supaboard may be newer in the market, but it still brings some impressive features that make it worth considering. In this article, you will discover the origins of Supaboard and Metabase, along with the key differences between the two.


What is Supaboard?

Supaboard is a modern, AI-powered business intelligence platform designed for teams that want fast insights without technical complexity. It unifies data from multiple sources and automatically transforms it into clear dashboards, visualizations, and metrics.
Unlike traditional BI tools that require SQL or manual setup, Supaboard focuses heavily on accessibility. Users can ask questions in natural language, explore trends instantly, and build dashboards without writing code.
Supaboard is built for speed helping teams move from raw data to insights.
Features of Supaboard
Ask AI: Get insights using natural language, no SQL required.
600+ Integrations: Connect SaaS, marketing, sales, finance, product finance, and data tools easily.
Instant Dashboards: Convert raw data into charts and dashboards instantly.
Query Builder: Create custom logic visually without coding.
Stella AI (3 Smart Modes):
Fast Mode: Quick answers for “what happened” questions.
Thinking Mode: Deeper analysis to explain “why it happened.”
Research Mode: Detailed insights and strategic recommendations.
Embedded Analytics: Add dashboards inside your app or portal.
Interactive Dashboards: Enterprise-grade visuals for all teams.
Collaboration Tools: Comments, sharing, team access, and permissions.
Cost Efficient: Scales without heavy IT setup.
Secure & Compliant: Robust permissions and governance.
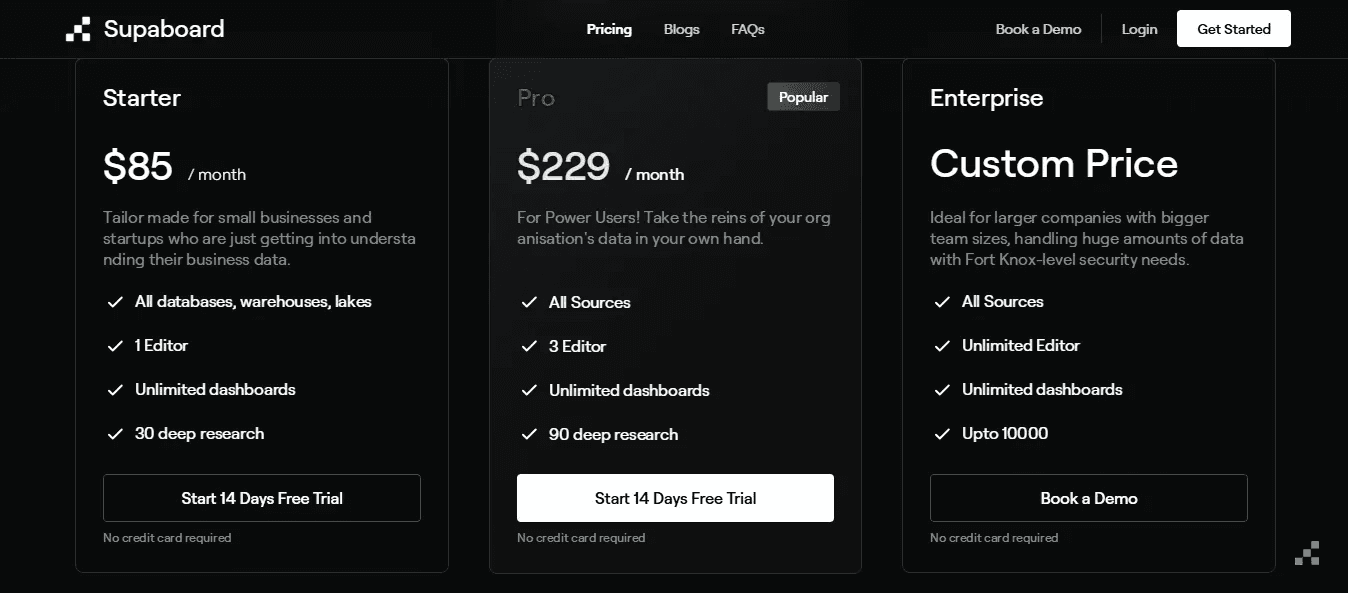
Supaboard Pricing
Supaboard offers Starter, Pro, and Enterprise plans designed for teams of all sizes. You can compare all features and limits here: View Supaboard Pricing
What is Metabase?
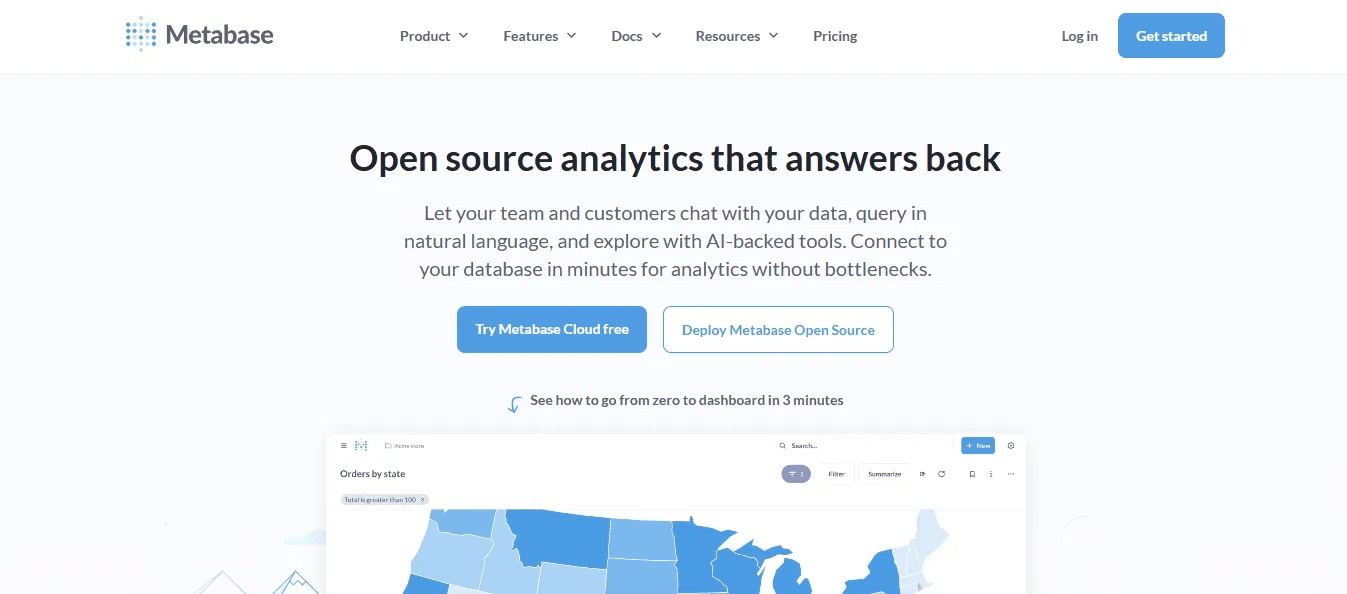
Metabase is an open-source business intelligence tool that helps teams explore their data and create visualizations without needing advanced technical skills. It was designed to make data analysis easier and more accessible for everyone. Metabase connects to popular databases like MySQL, PostgreSQL, and MongoDB, allowing teams to work with their existing data sources seamlessly.
Its interface is simple and user friendly, making it easy to build charts, run queries, and organize everything into dashboards. Metabase focuses on helping users understand their raw data quickly through clean visuals and straightforward exploration features.
Features of Metabase
Multiple Visualization Options: Charts, graphs, heatmaps, scatter plots, and more for flexible reporting.
Interactive Data Exploration: Drill-downs, filters, and sorting to understand data in detail.
Custom Dashboards – Build and organize dashboards to highlight KPIs and important metrics.
User-Friendly Interface – Simple navigation with helpful guides and tooltips.
Customization Tools – Adjust colors, layouts, and formatting to suit your reporting style.
Custom Queries – Create SQL or no-code queries to extract deeper insights.
Data Security – Granular access controls to protect sensitive information.
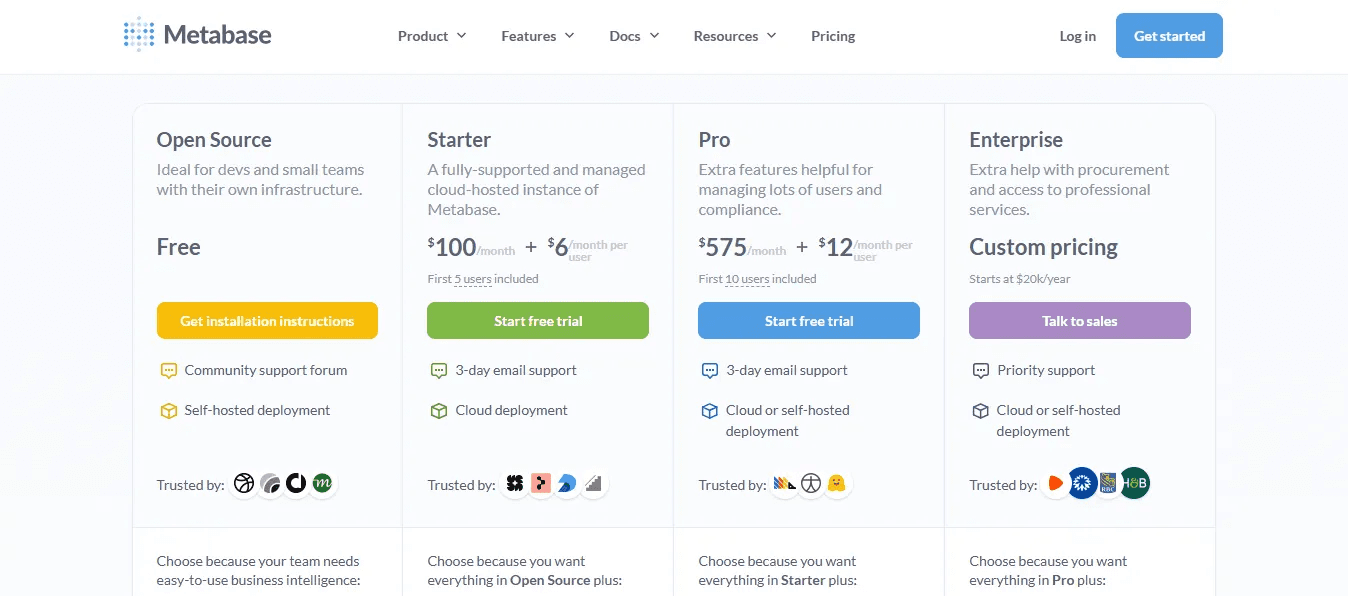
Metabase Pricing
Metabase has an open-source self-hosted version, cloud plans, and enterprise tiers. Full pricing details are available here: View Metabase Pricing
What’s the Difference Between Supaboard and Metabase?
Supaboard and Metabase are both popular BI tools, but they differ mainly in how fast and accessible they make data analysis. Metabase is great for basic dashboards and SQL-friendly teams, while Supaboard focuses on AI automation, no-code simplicity, and 600+ one-click data integrations that eliminate the need to switch between multiple tools. Supaboard also offers instant visualizations, natural-language queries, and Stella AI’s three smart modes for deeper insights. In short, Metabase helps you explore data, but Supaboard helps you understand it faster.
To make it clearer, we’ve explained everything briefly in the Supaboard vs Metabase comparison table below.
Supaboard vs Metabase Comparison Table
Feature | Supaboard | Metabase |
|---|---|---|
AI Capabilities | Stella AI (Fast, Thinking, Research modes) | No built-in AI insights |
Natural Language Queries | Yes | Very limited / basic |
Integrations | 600+ native one-click connectors | Supports major databases (MySQL, PostgreSQL, MongoDB, etc.) |
Visualization Options | Instant table to chart & auto dashboard creation | Multiple charts: bar, line, pie, scatter, heatmaps |
Data Exploration | AI explanations + no code filters | Filters, sorting, and custom SQL |
No-Code Dashboards | Fully no code, instant visuals | Supported but more manual |
Visual Query Builder | Yes, build custom logic without SQL | SQL editor required for complex queries |
Embedded Analytics | Native embed for dashboards in apps | Supported but requires more setup |
Security & Access Control | Read only connections, granular permissions, audit logs | Granular access control |
Data Governance | Built in governance features | Basic governance via permissions |
Best Fit | Teams needing AI insights & 600+ integrations | SQL-friendly teams using open-source BI |
What Makes Supaboard a Good Choice Compared to Metabase?
AI-Powered Analytics (Stella AI): It delivers instant insights, trend explanations, and smart recommendations.
600+ Seamless Integrations: Connects CRMs, finance tools, ad platforms, warehouses, and e-commerce systems without complex setup.
No-Code Dashboards & Smart Visuals: Quickly converts data into clean, interactive charts and dashboards with minimal effort.
Faster Decision Making: AI eliminates the need to jump between tabs or run multiple queries to find answers.
Scalable for Growing Teams: Ideal for SaaS, HealthTech, FinTech, and enterprise teams managing large, evolving datasets.
Low Maintenance: Cloud-native infrastructure removes server management and technical overhead.
When Might Metabase Be a Better Fit Than Supaboard?
If your team prefers open source tools and wants full control over customization.
You have the time and resources to manage implementation, deployment, and ongoing maintenance.
If the team prefers a lightweight, developer-friendly analytics setup without AI-driven features.
Supaboard Testimonial
“Switching to Supaboard changed how our entire team works with data. For the first time, marketing, sales, and operations could explore insights without waiting on analysts. The AI suggestions alone saved us hours every week.”
— Product Lead, SaaS Company
Frequently Asked Questions
1. Which is better for beginners: Supaboard or Metabase?
Supaboard is easier for quick setup, while Metabase is better if you prefer a traditional, query-driven BI workflow.
2. Do both tools require SQL to build dashboards?
No. Both allow SQL, but you can also create dashboards without writing queries, depending on your workflow and data complexity.
3. When is Supaboard a better choice than Metabase?
Supaboard is a better fit when you want faster setup, broader integrations, and AI-driven insights without managing servers or relying heavily on SQL.
4. What’s the best Business Intelligence tool?
There’s no right or wrong answer here. It’s generally depend on your use case. Supaboard performs best in AI automation and speed, Metabase is great for open-source customization, Tableau shines in deep visualization, and Power BI is strong for enterprise reporting.
5. What type of companies benefit most from BI software?
Any data driven team from SaaS and e-commerce to healthcare, finance, and logistics can benefit. BI helps monitor performance, optimize operations, and make decisions backed by real-time insights.
6. Which tool offers more integrations?
Supaboard supports hundreds of modern SaaS, analytics, and marketing integrations, while Metabase mainly focuses on core databases and data warehouses.
7. Can BI tools replace manual reporting?
For most teams, yes. Modern BI automates dashboards, updates data in real time, and reduces reliance on spreadsheets saving hours of manual reporting work every week.


